Visualize and Replay Data
There are two modes for visualizing data in Ouster Studio: Sensors (Live Sensor Visualizer) and Local Files (Replay Mode).
Fig. 11 Sensors (Live Sensor Visualizer) and Local Files (Replay Mode)
Sensors (Live Sensor Visualizer)
Live Sensor Visualizer corresponds to the situation where an Ouster sensor is directly accessible over the network from the computer running Ouster Studio. In this case, the live sensor visualizer enables visualization of the current output of the sensor.
Ouster Studio capable of listing all Ouster sensors connected to the network automatically so the user can choose the sensor to be configured and visualized.
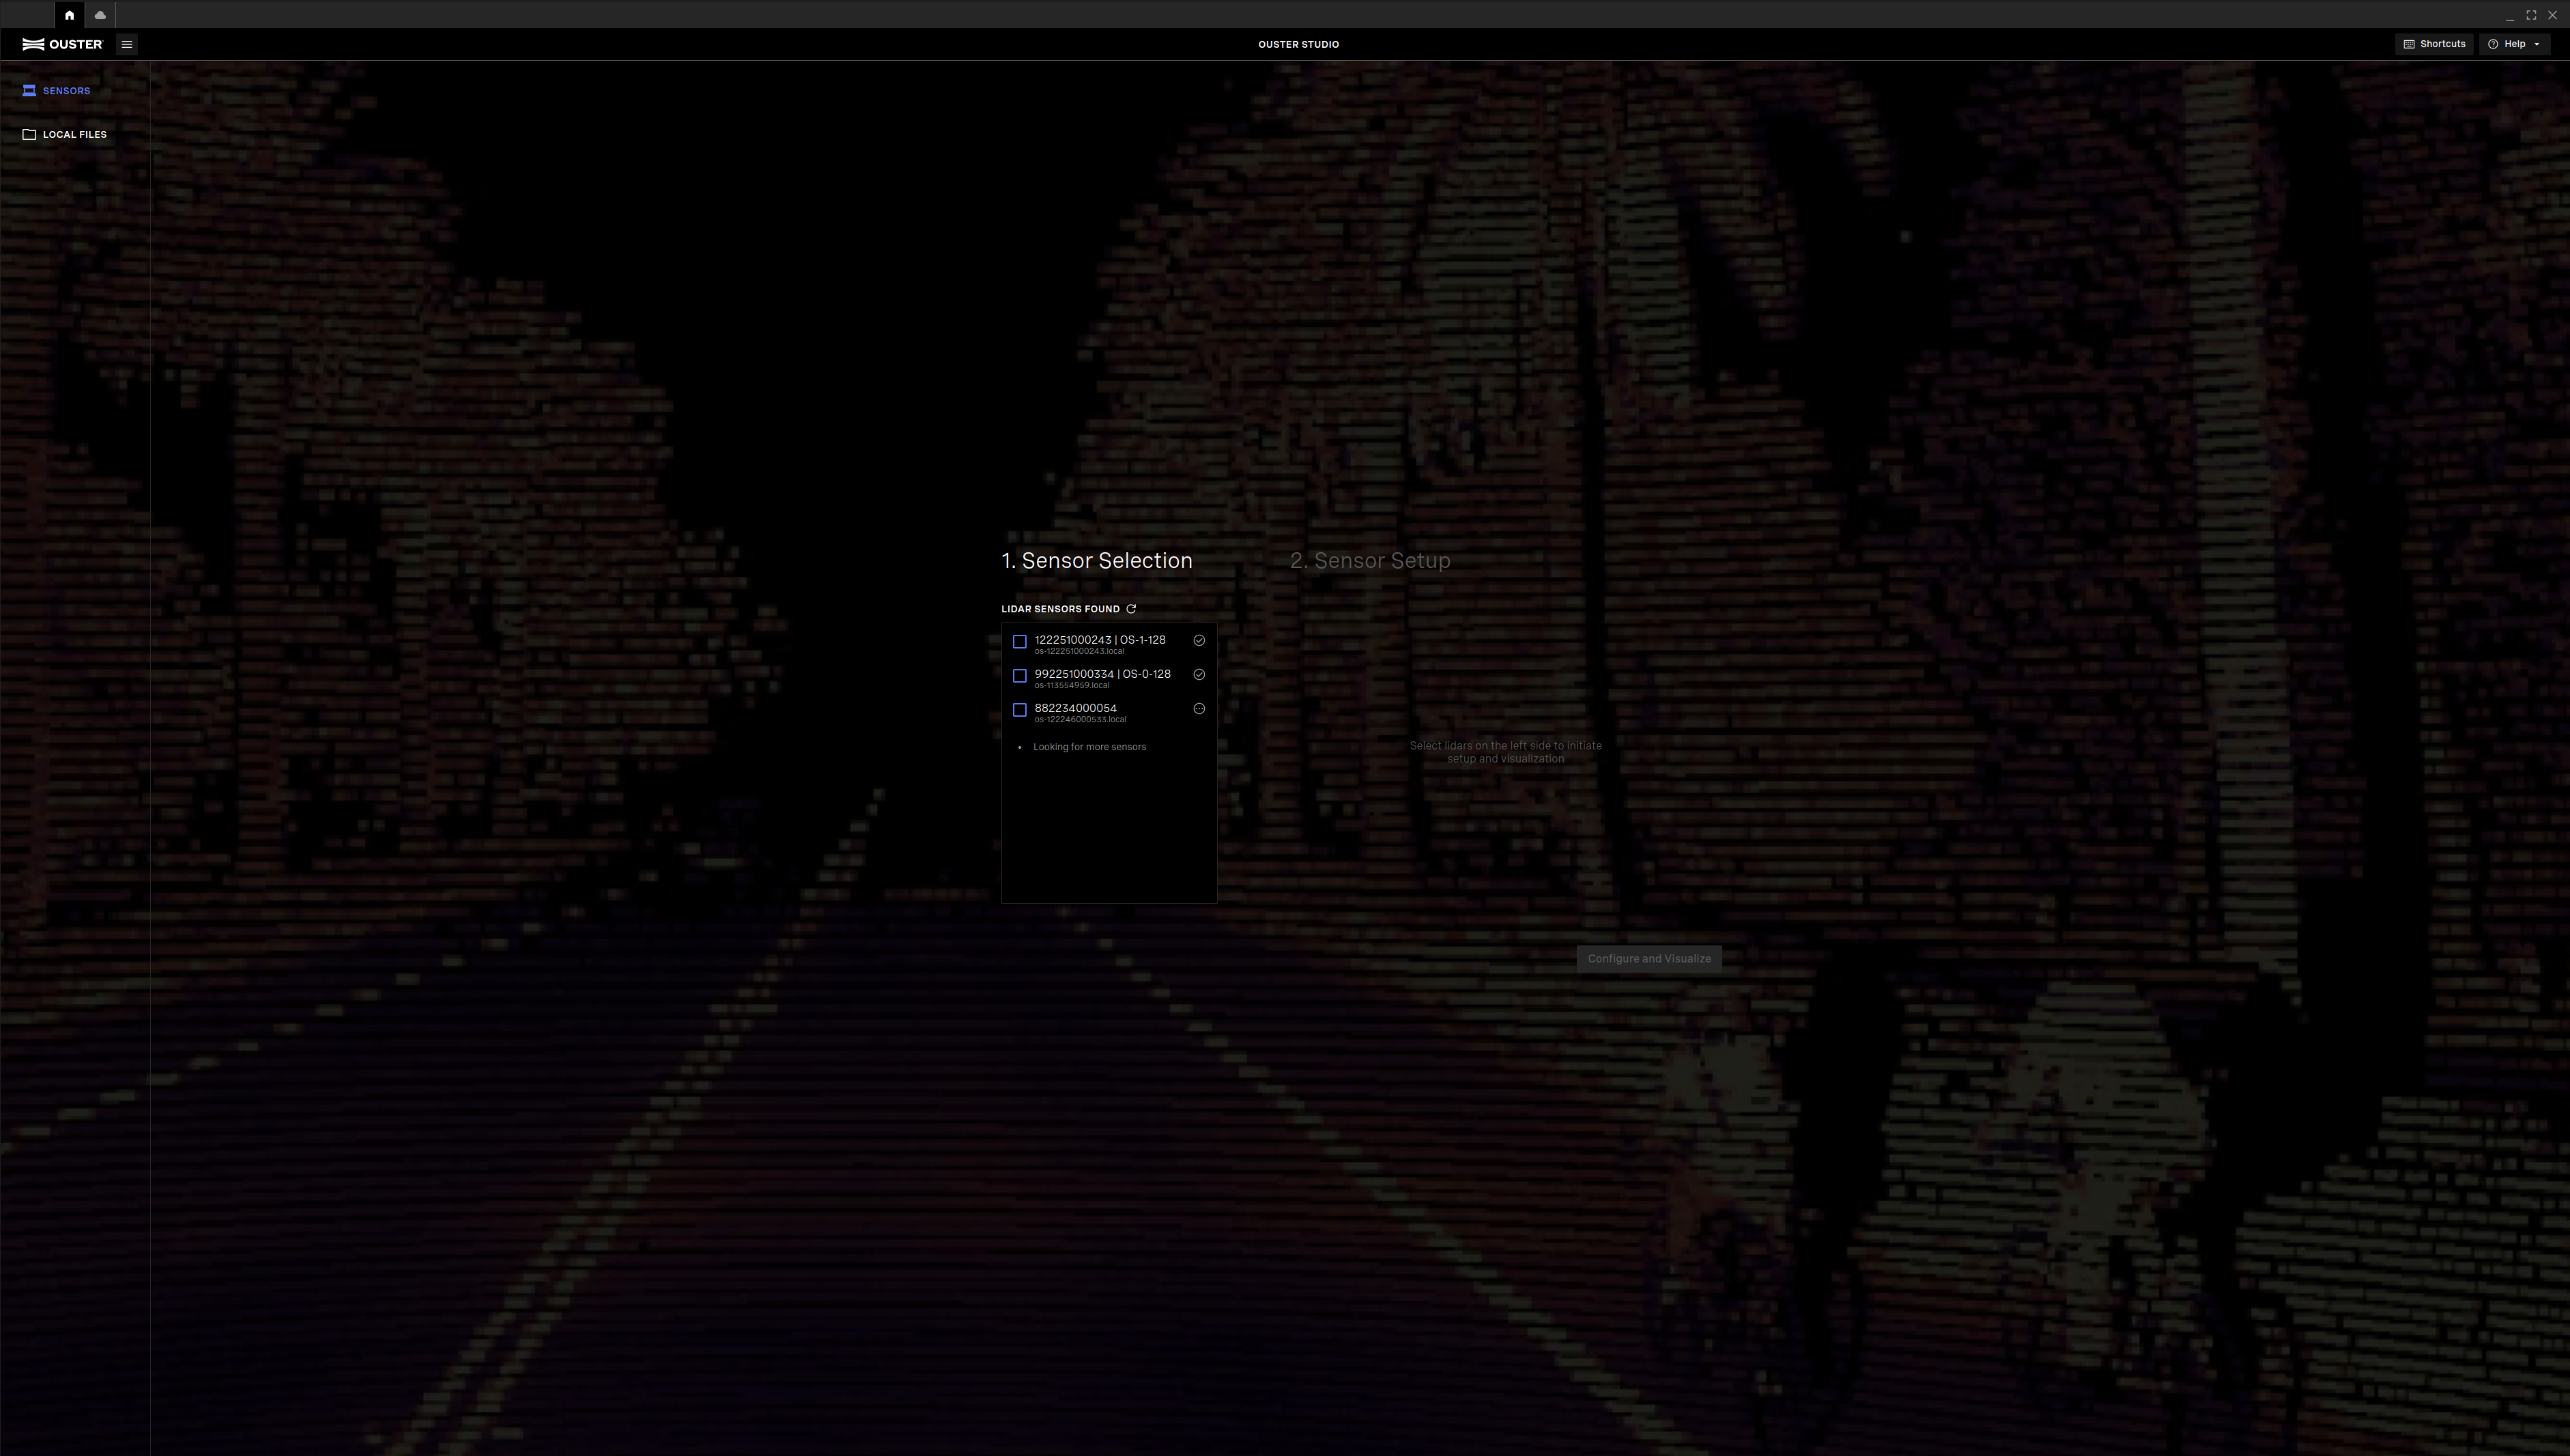
Fig. 12 Automatic Sensor Discovery
Once the sensor is selected, you can refer to the current configuration parameters of the sensors.
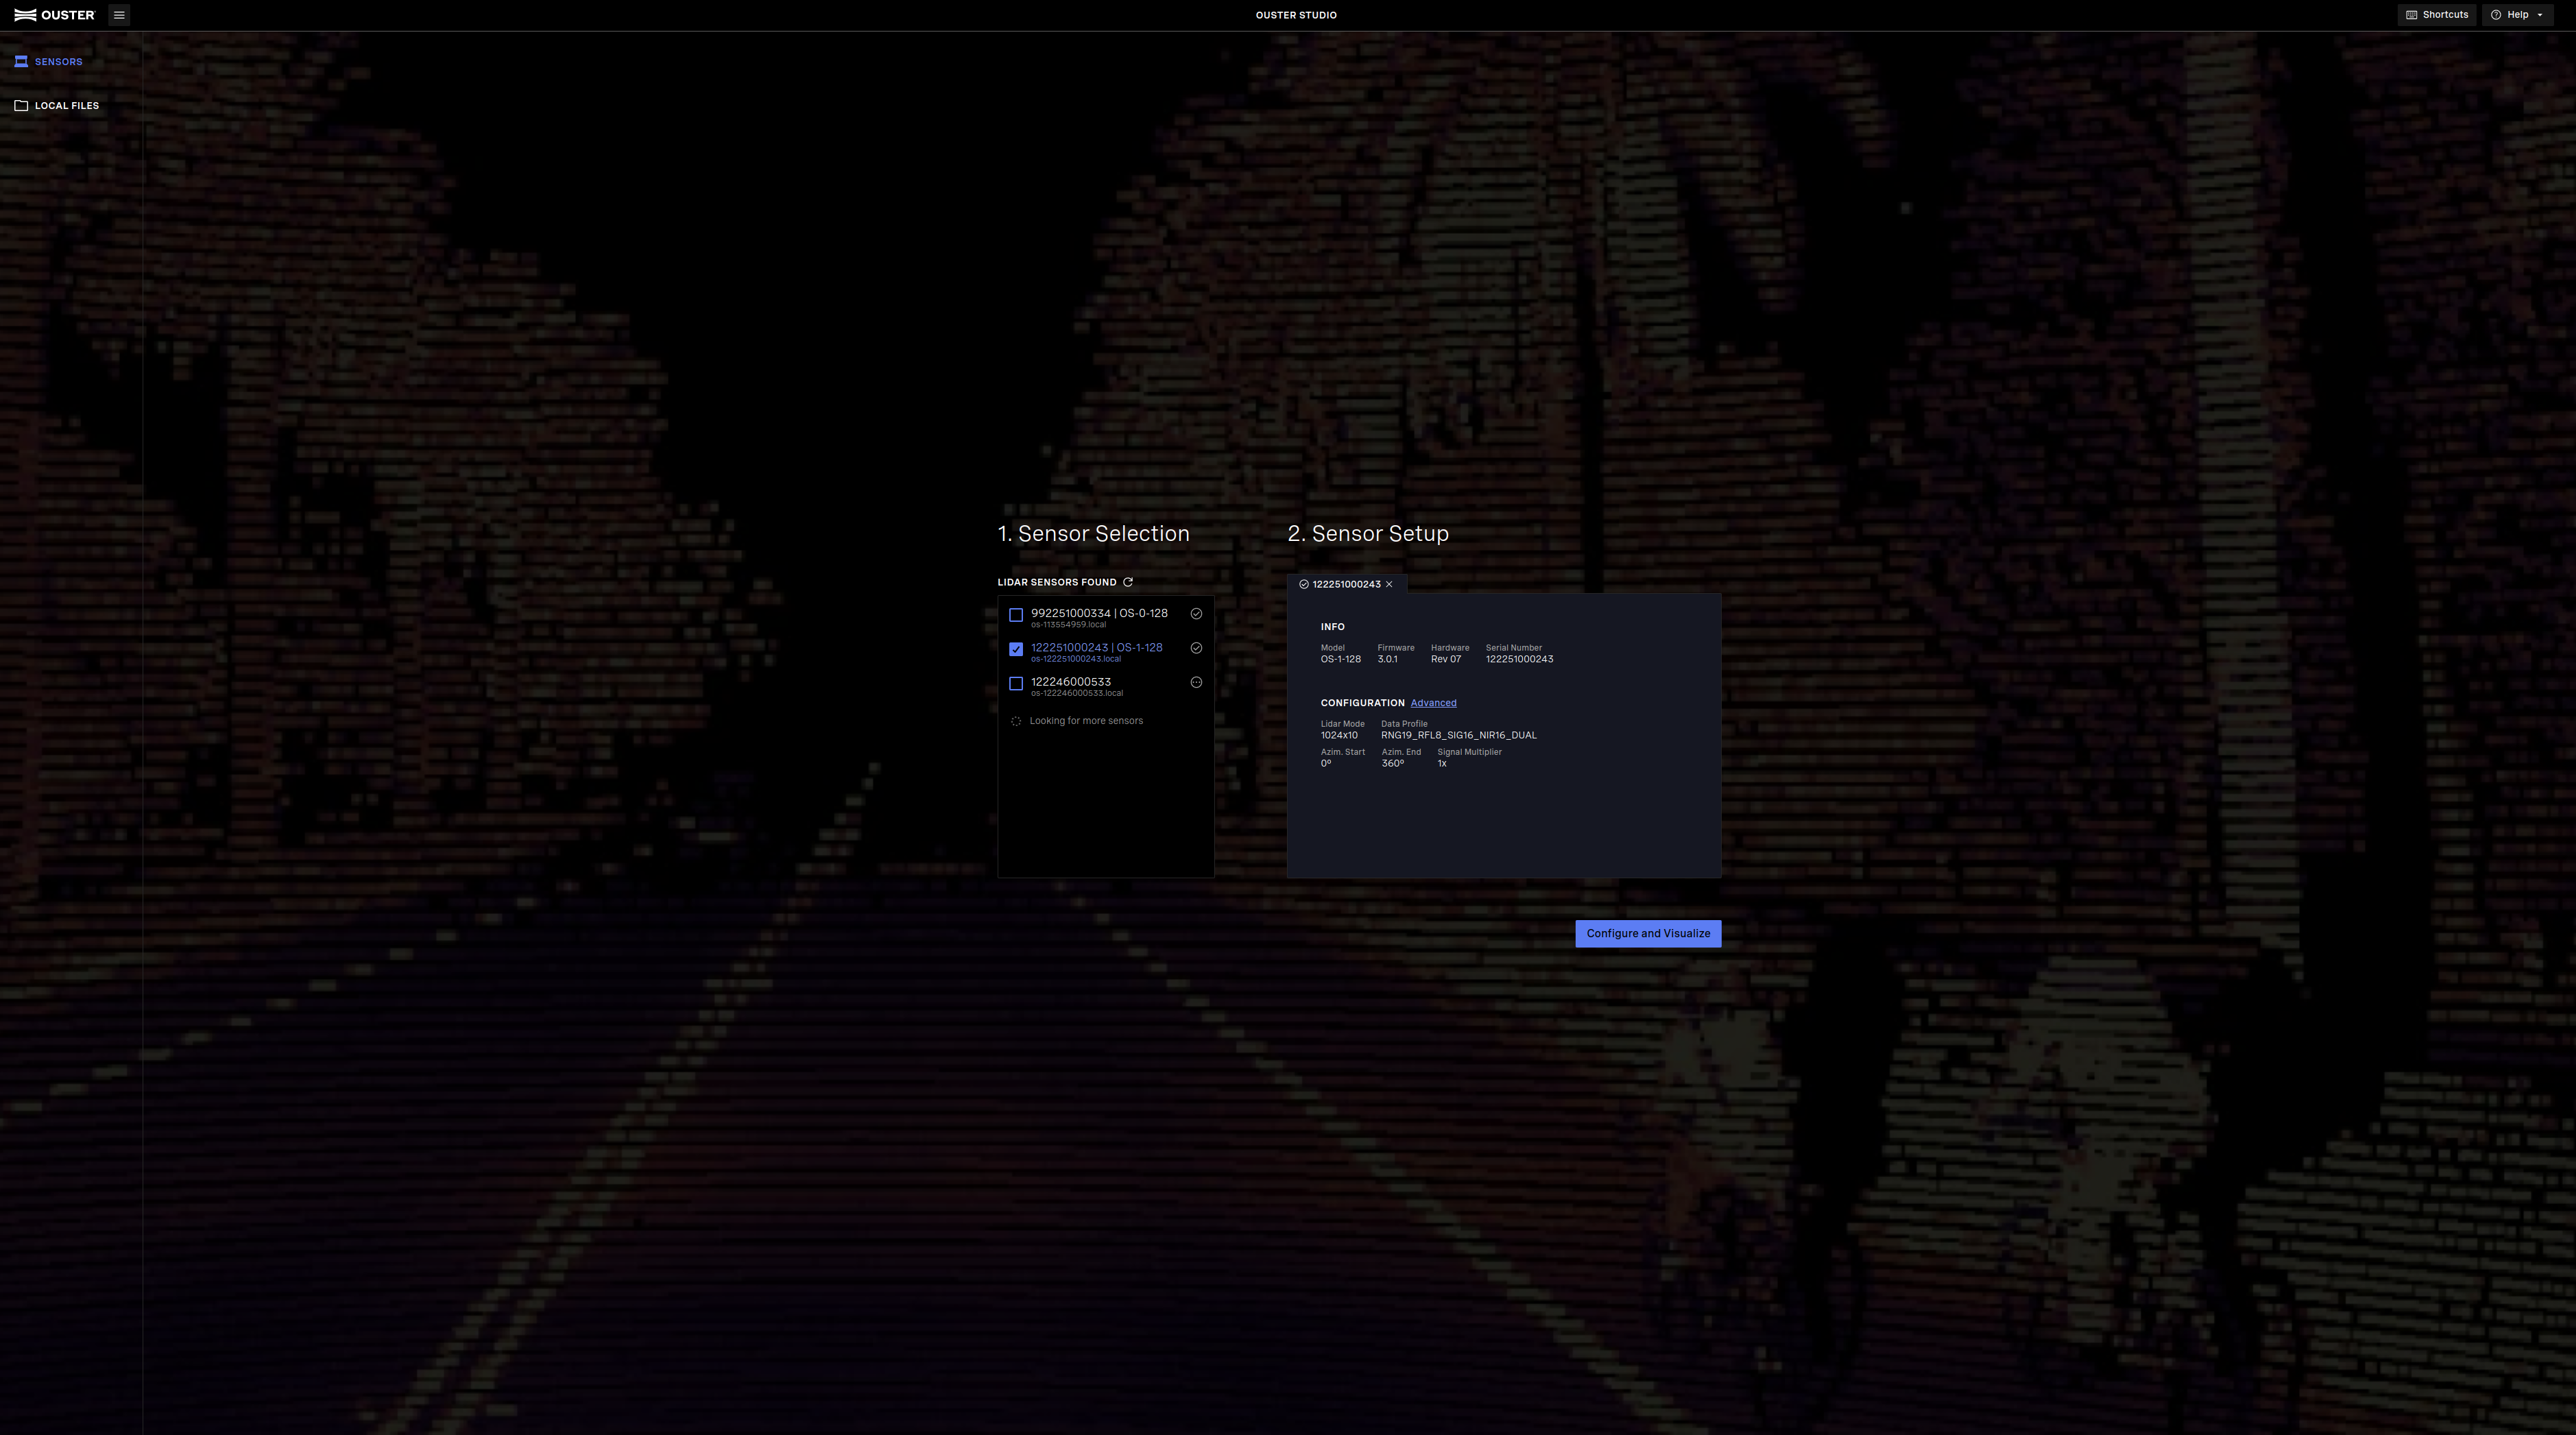
Fig. 13 Sensor Configuration Overview
User can configure advanced settings by clicking advanced here, which will pop up another tab i.e., Ouster Sensor Dashboard (Refer to Firmware User Manual for more information).
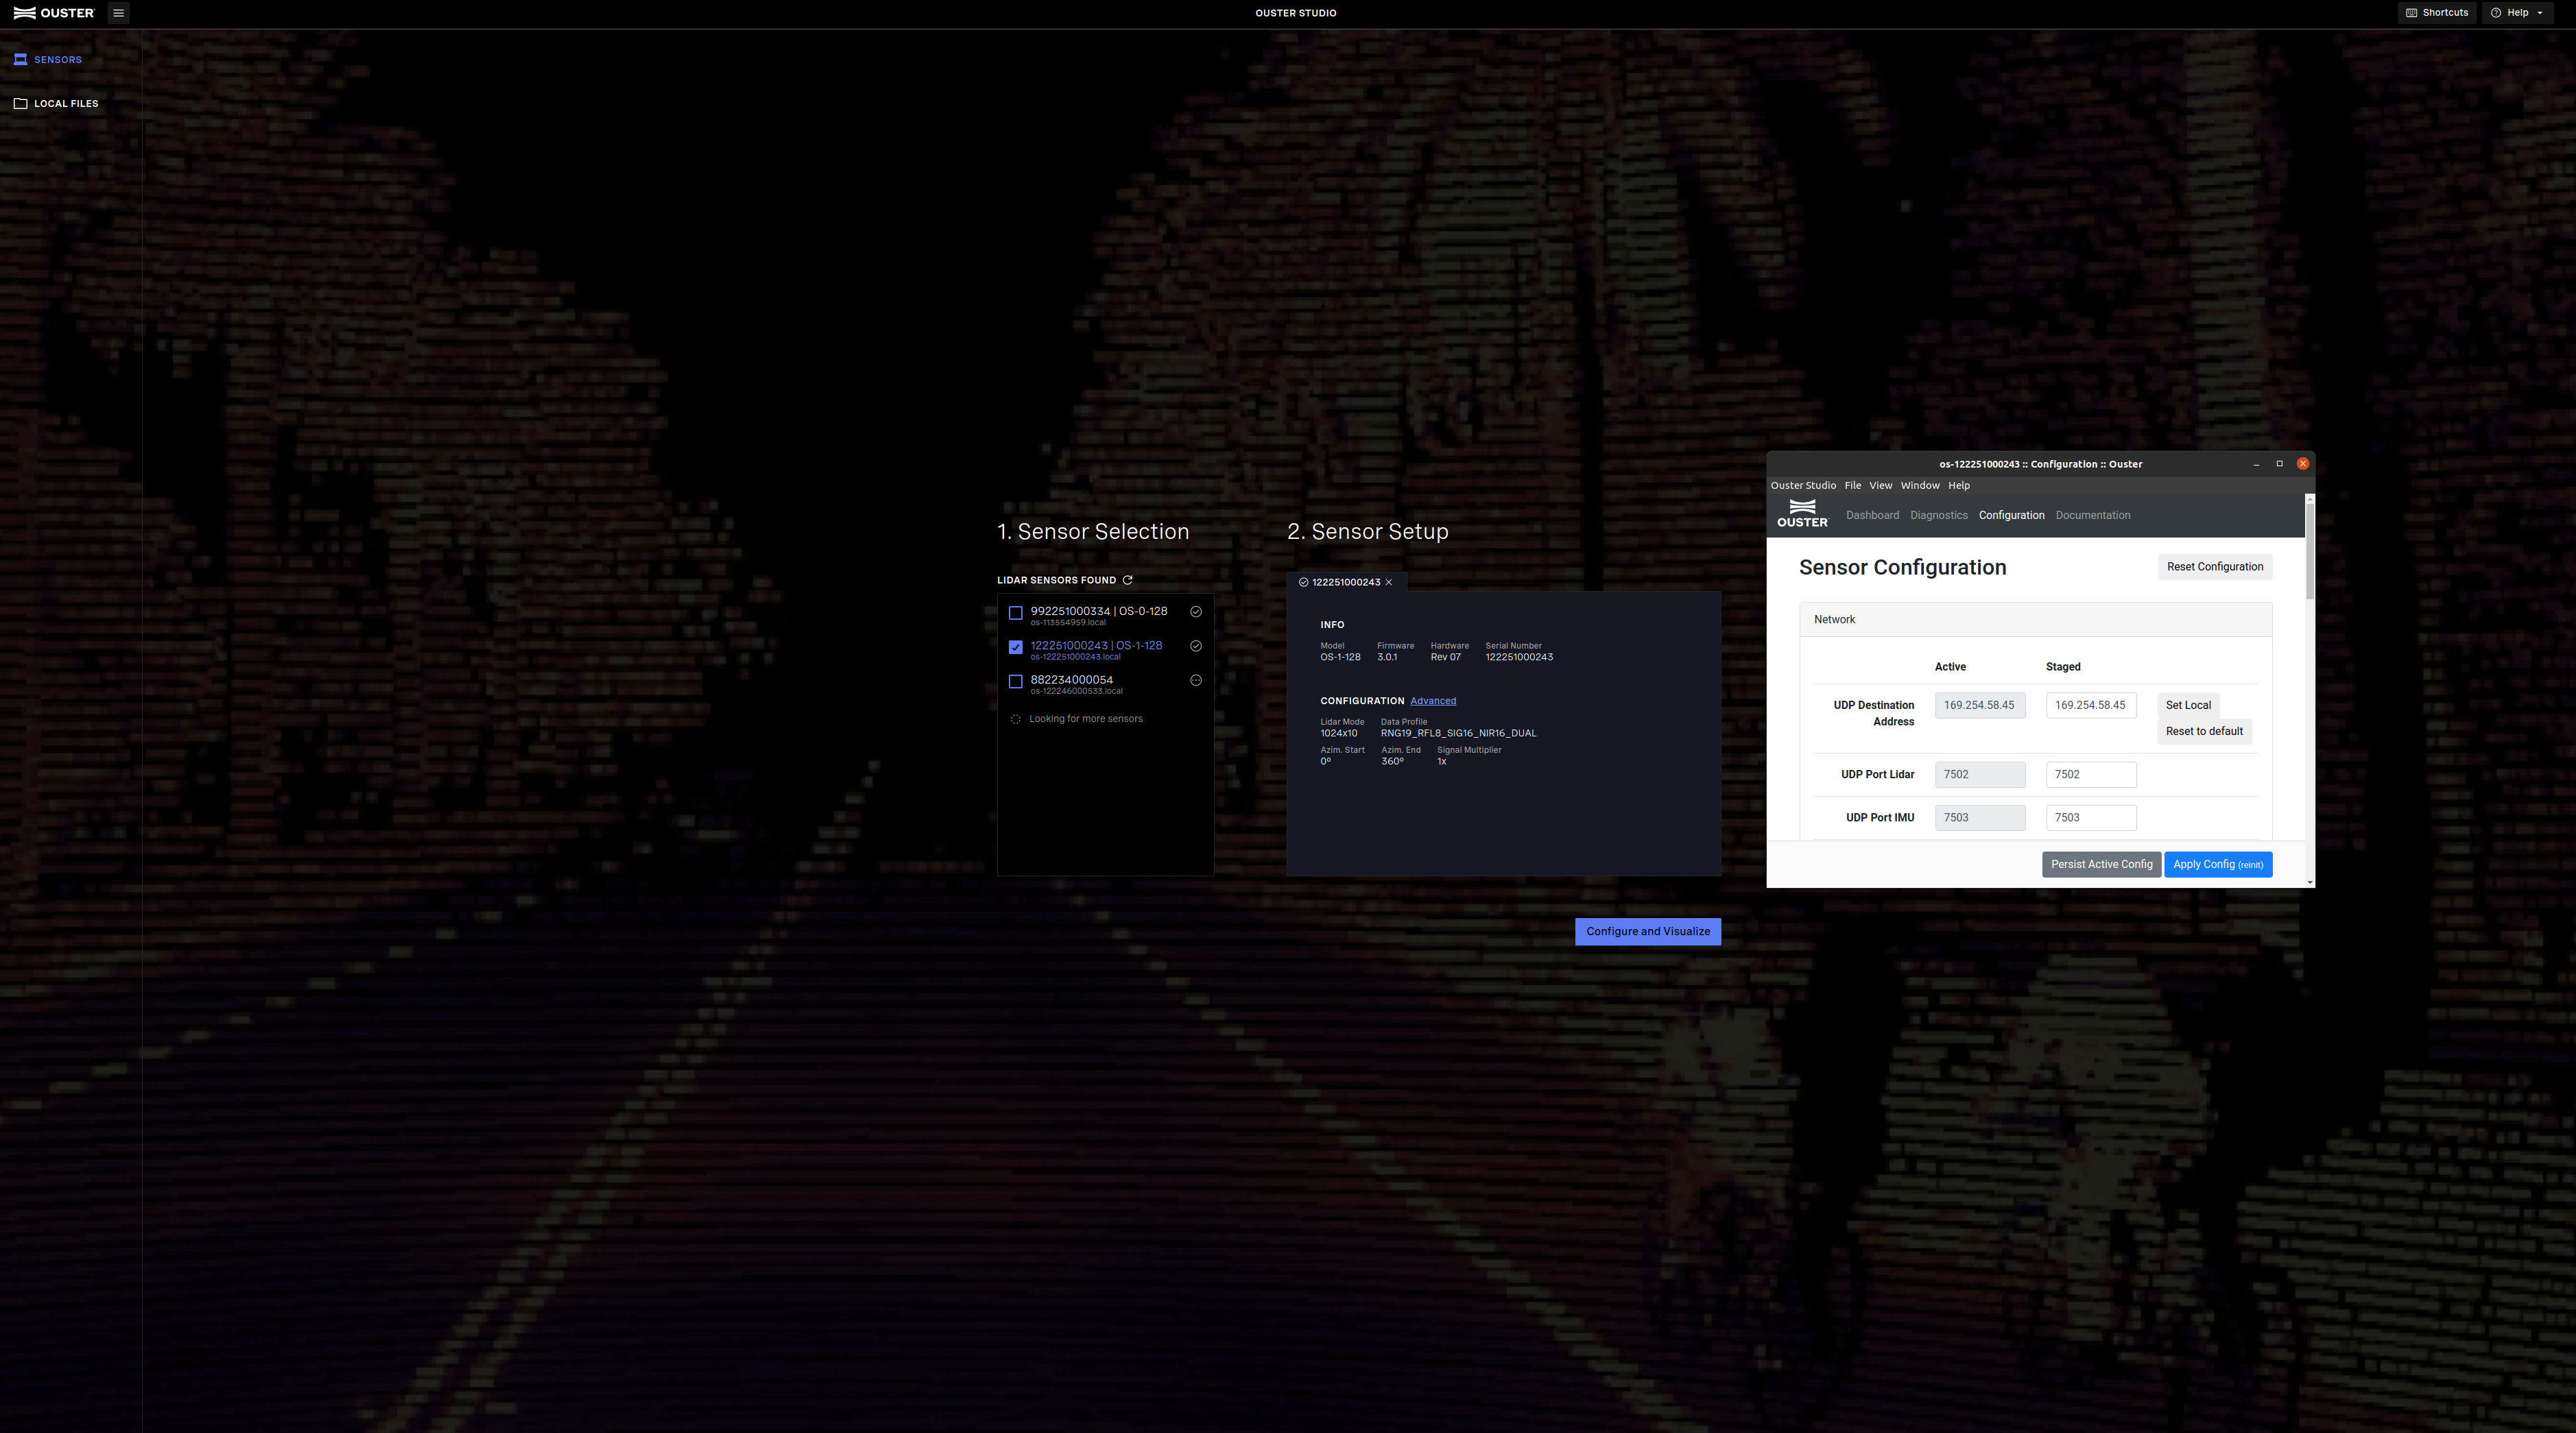
Fig. 14 Advanced Configuration
Local Files (Replay Mode)
The Replay Mode corresponds to the situation where the user has recorded a live stream in .pcap format and wants to replay it.
Note
Please make sure to upload .pcap and corresponding .json file, failure to do so can result incorrect visualization.
If you have a .pcap file and its respective .json file containing Ouster lidar sensor data (recorded using Ouster Studio or Ouster SDK or have Sample Data) it is possible to display the data in Ouster Studio by using the Local Files option.
User can browse files locally and select .pcap and its respective .json file to replay the point cloud data.
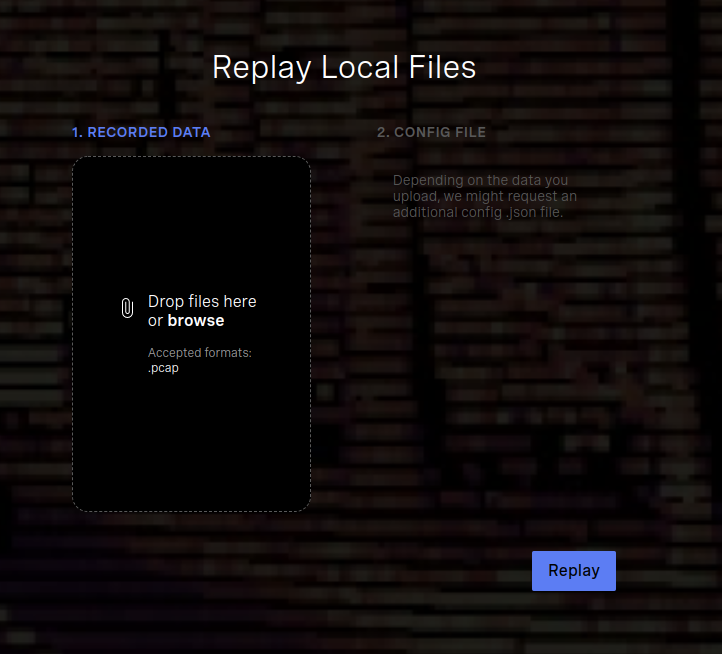
Fig. 15 Replay Mode |
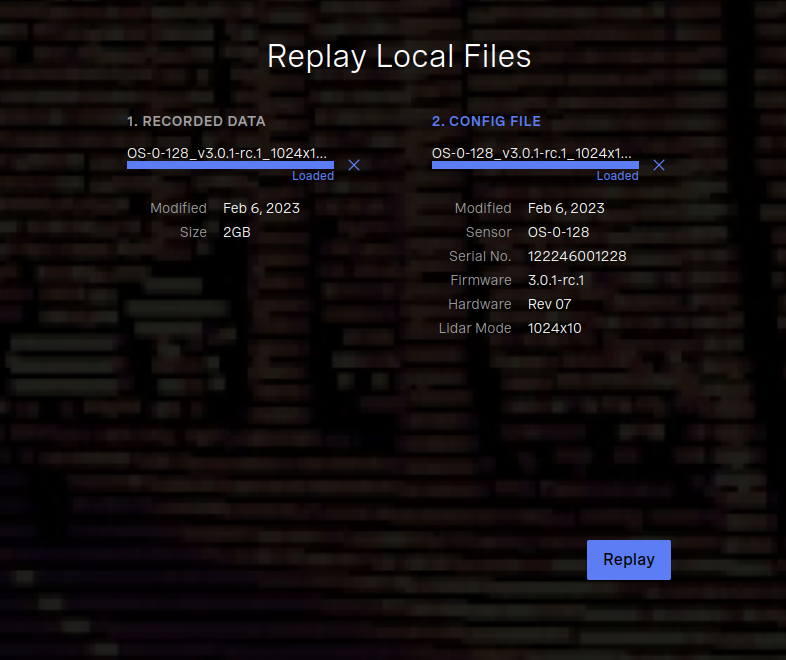
Fig. 16 Select .pcap and .json file |
User can now visualize the data and can use a mouse or a keypad to move x,y,z on the point cloud.
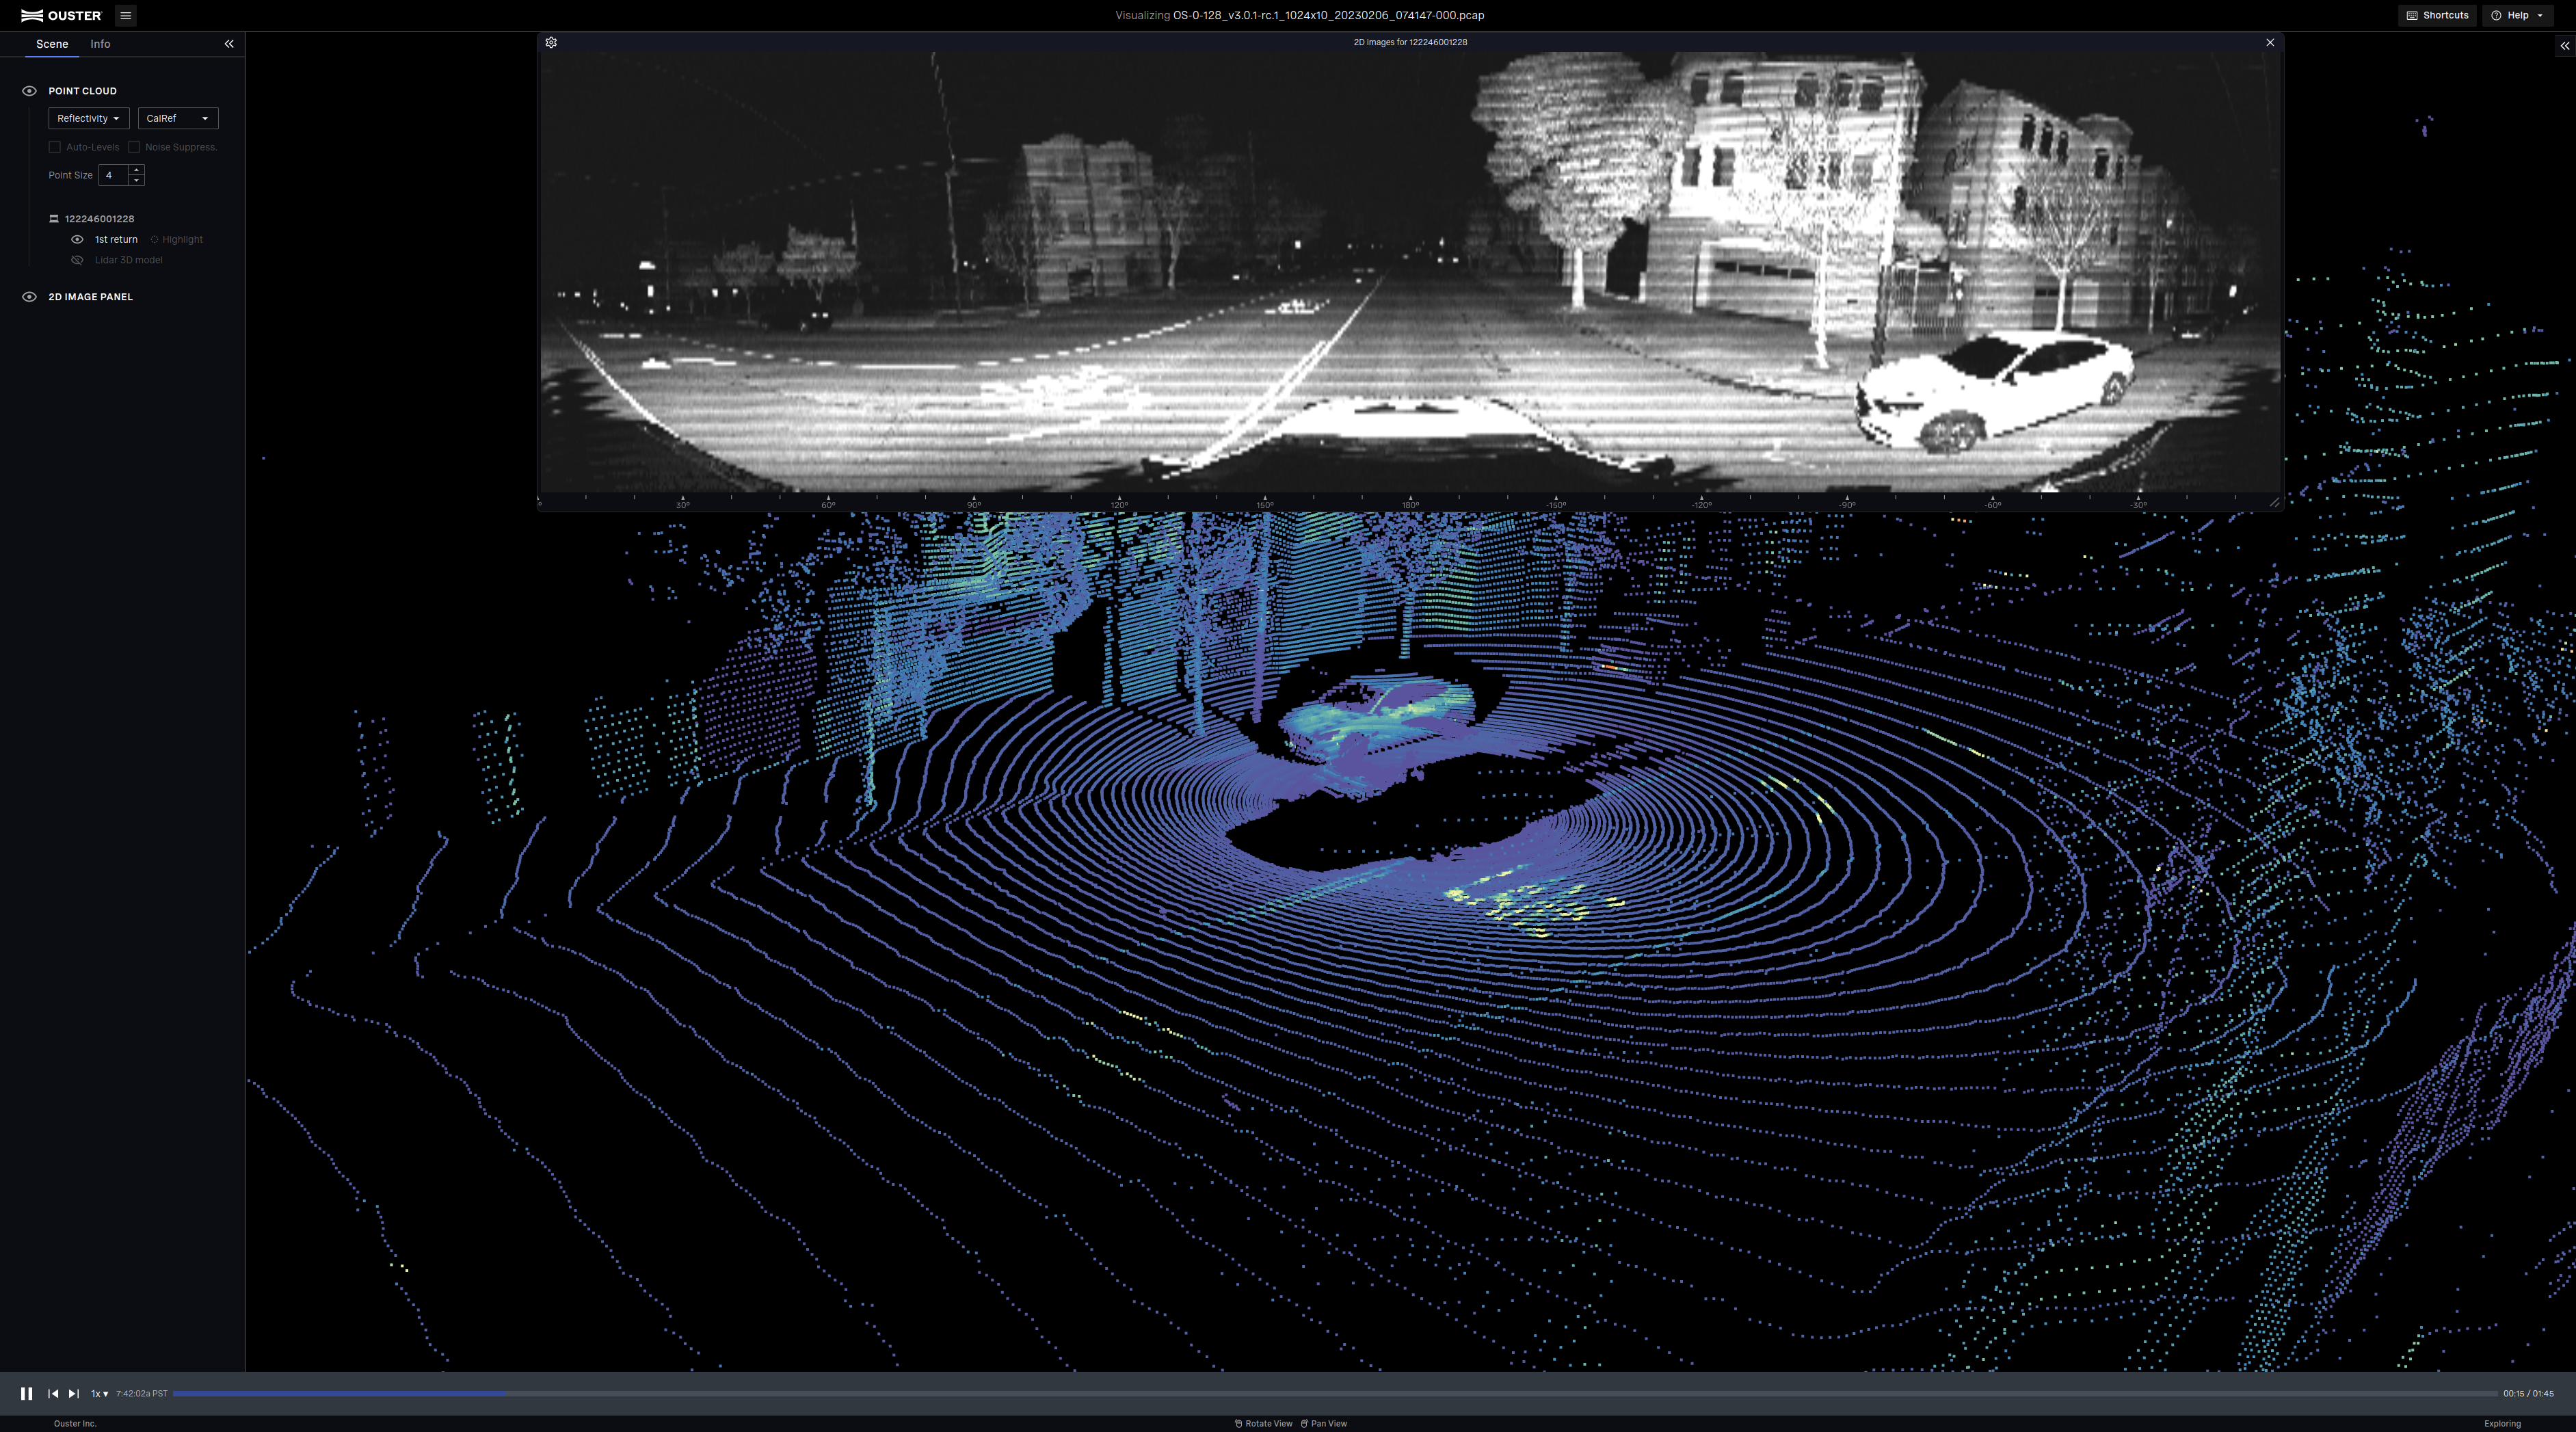
Fig. 17 Playback 3D point cloud
Ouster Studio Software Layout
Once you are visualizing in Ouster Studio, different tools are available to analyze, enhance, and understand the data. Ouster Studio has four distinct layouts:
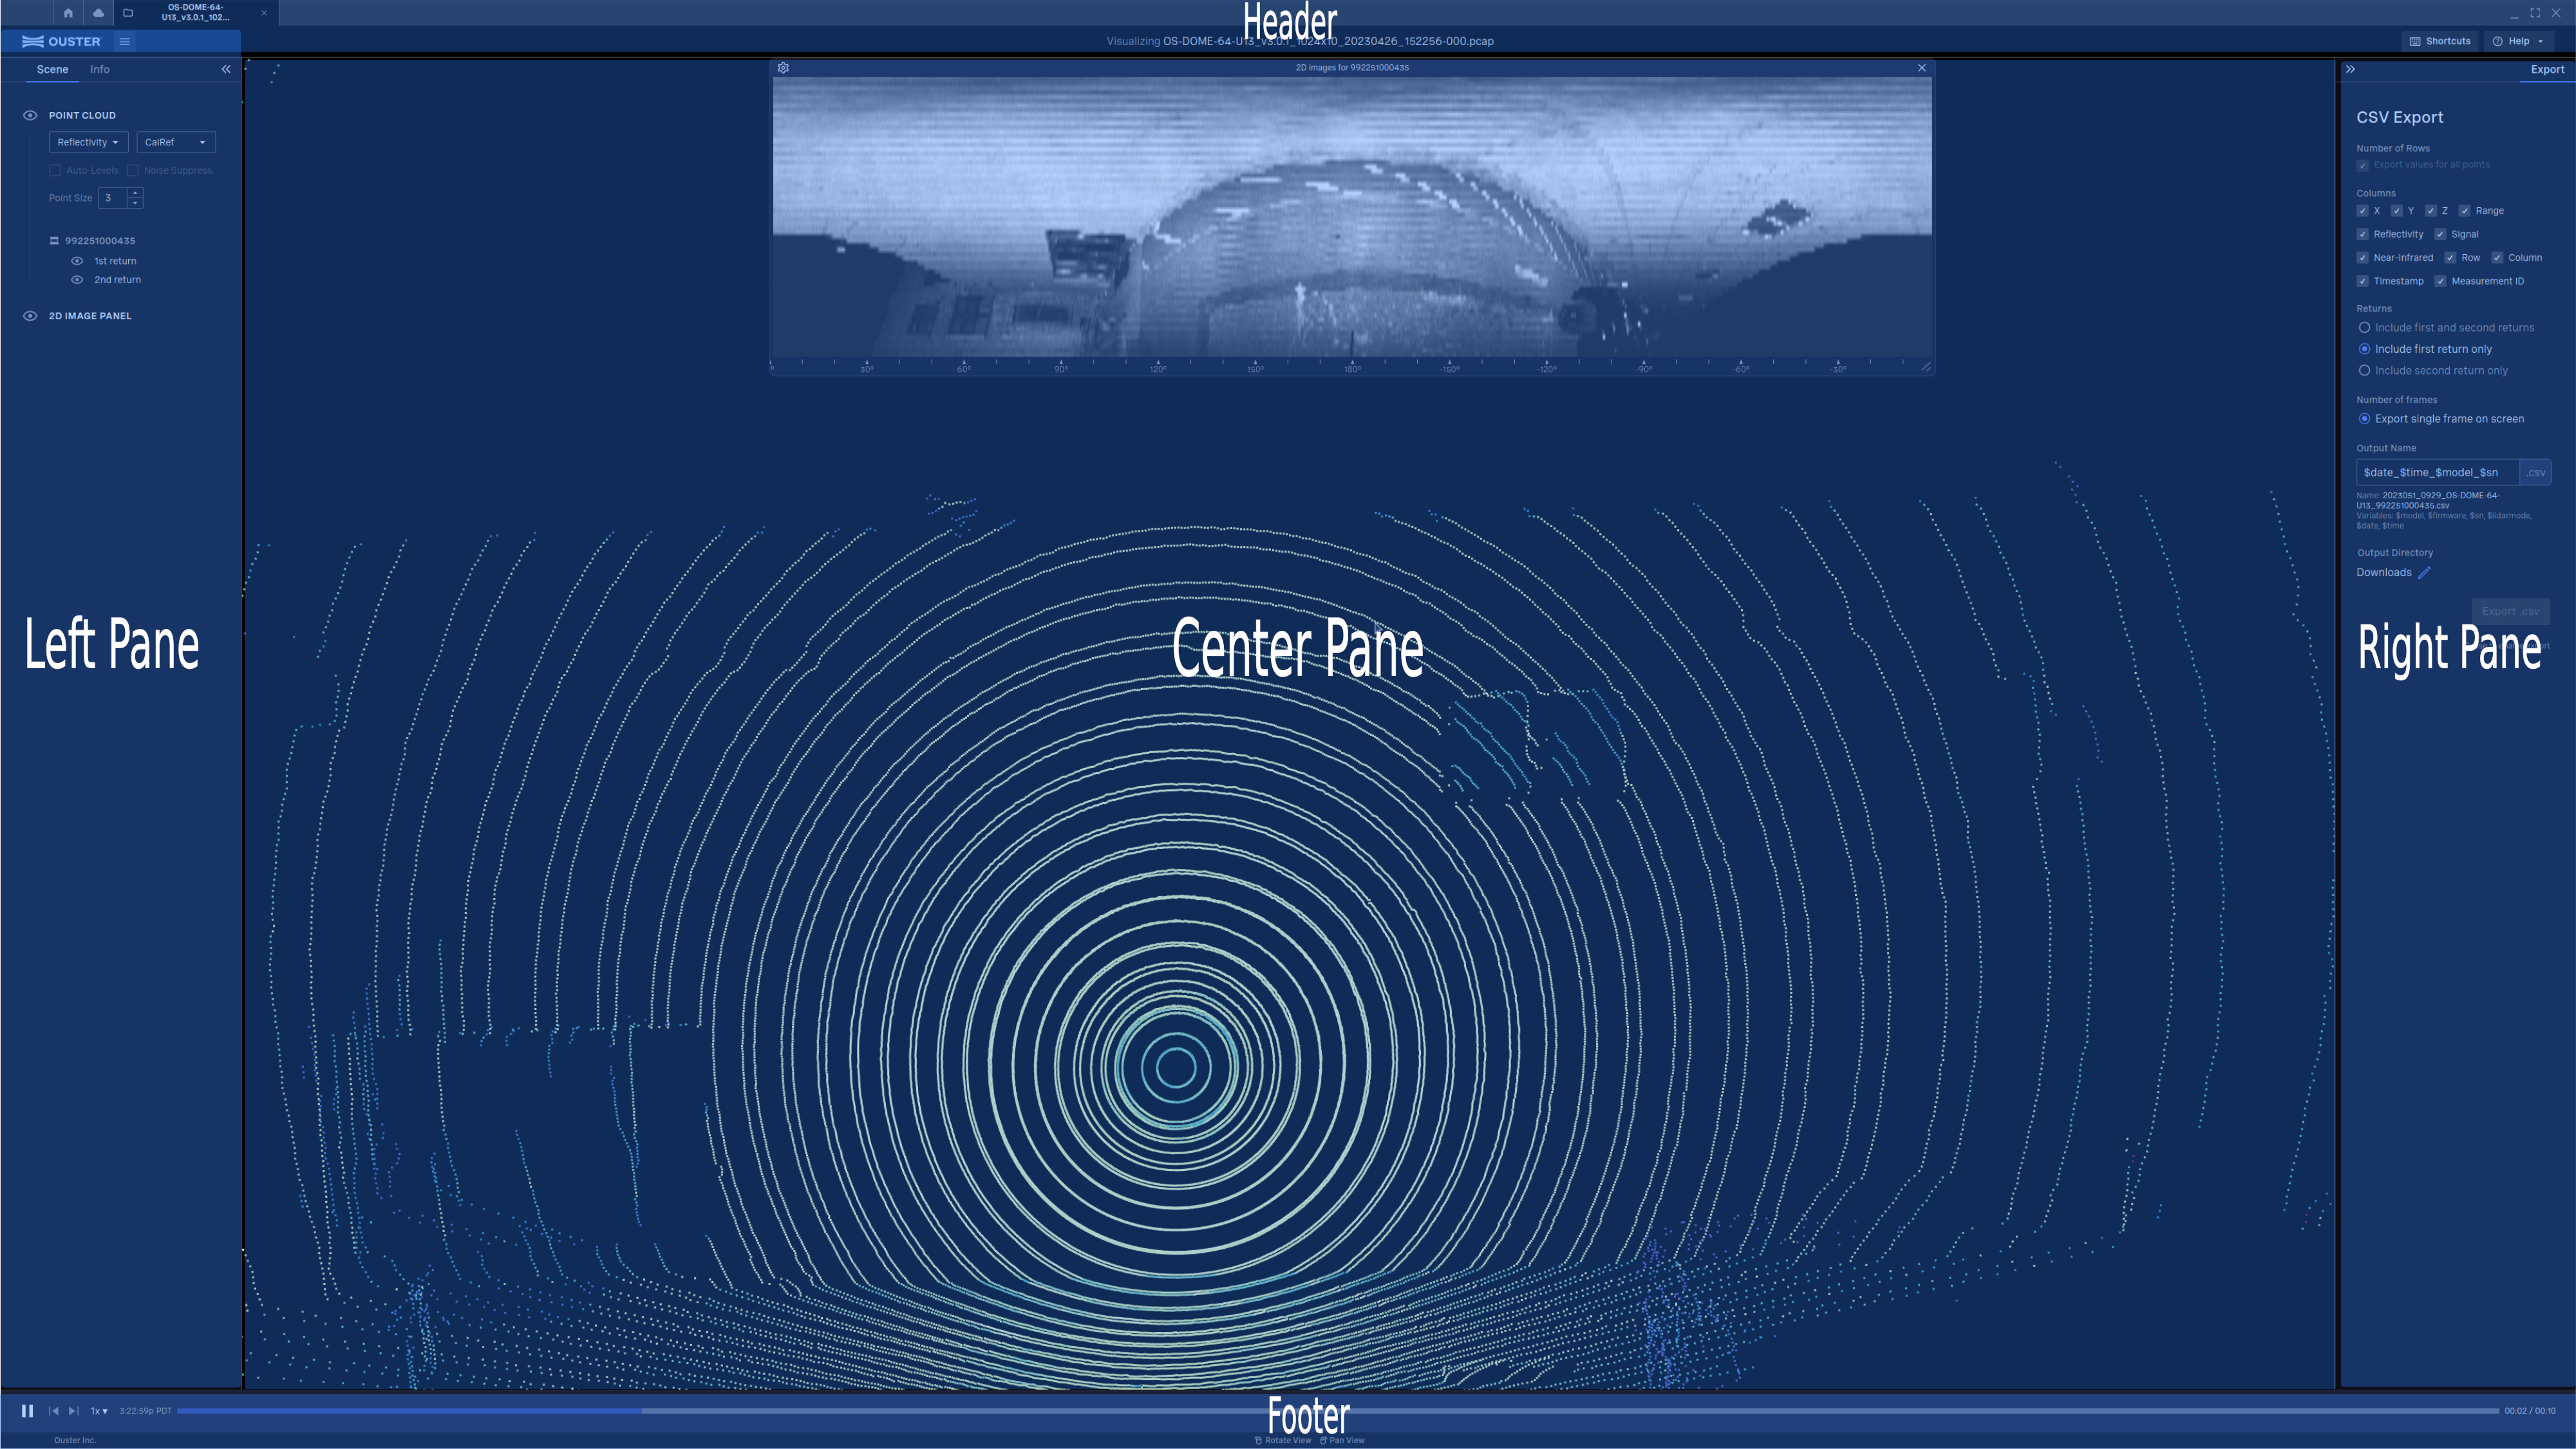
Fig. 18 Ouster Studio Layout
Header
Header comprises of the following:
Home and an option for multiple tabs that can be open to either view a sensor live stream or to playback
.pcapfiles.

Fig. 19 Header - Home and Tabs
Shortcut keys - To help users have easy access using keyboard.
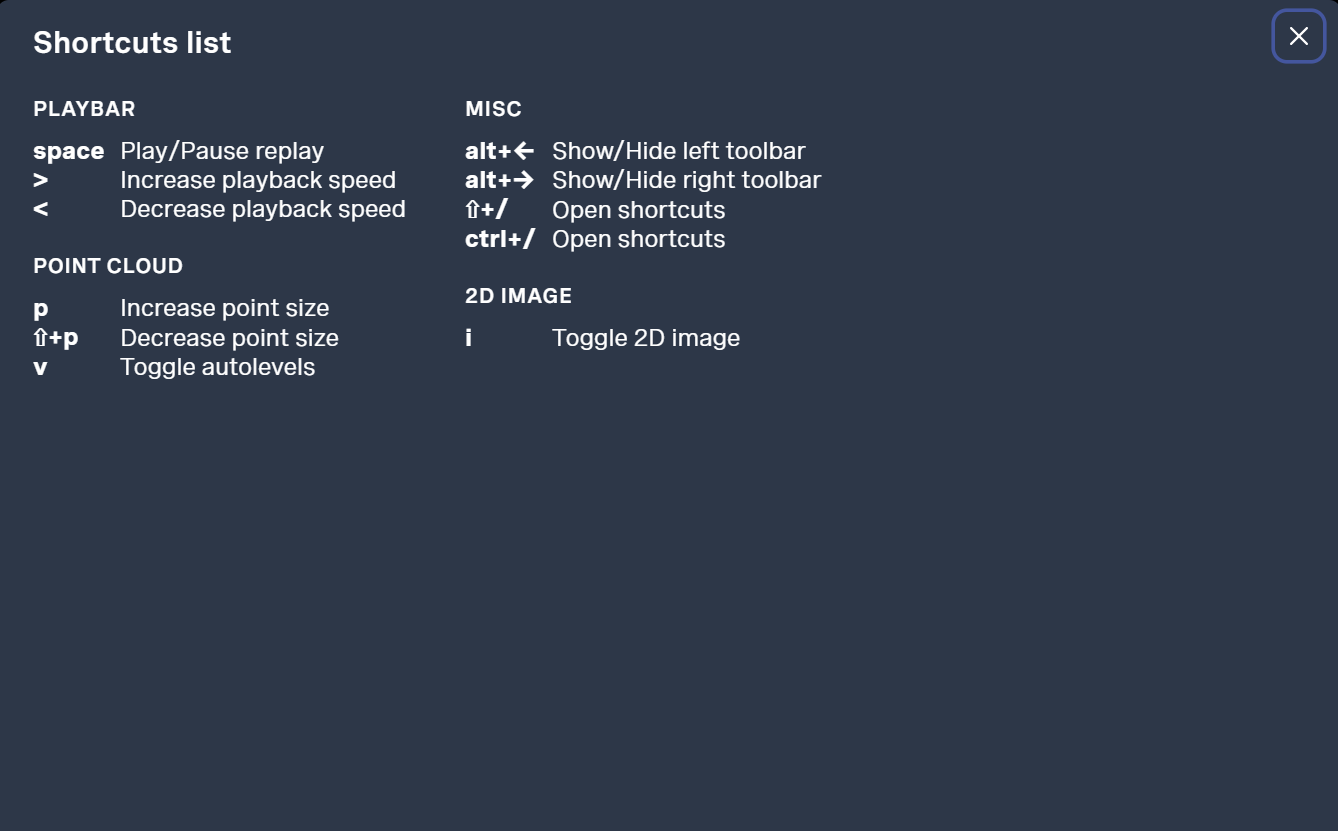
Fig. 20 Shortcut Keys
Help (Ouster Support, Feedback , License and Quick Start Guide) to support any user access issues.
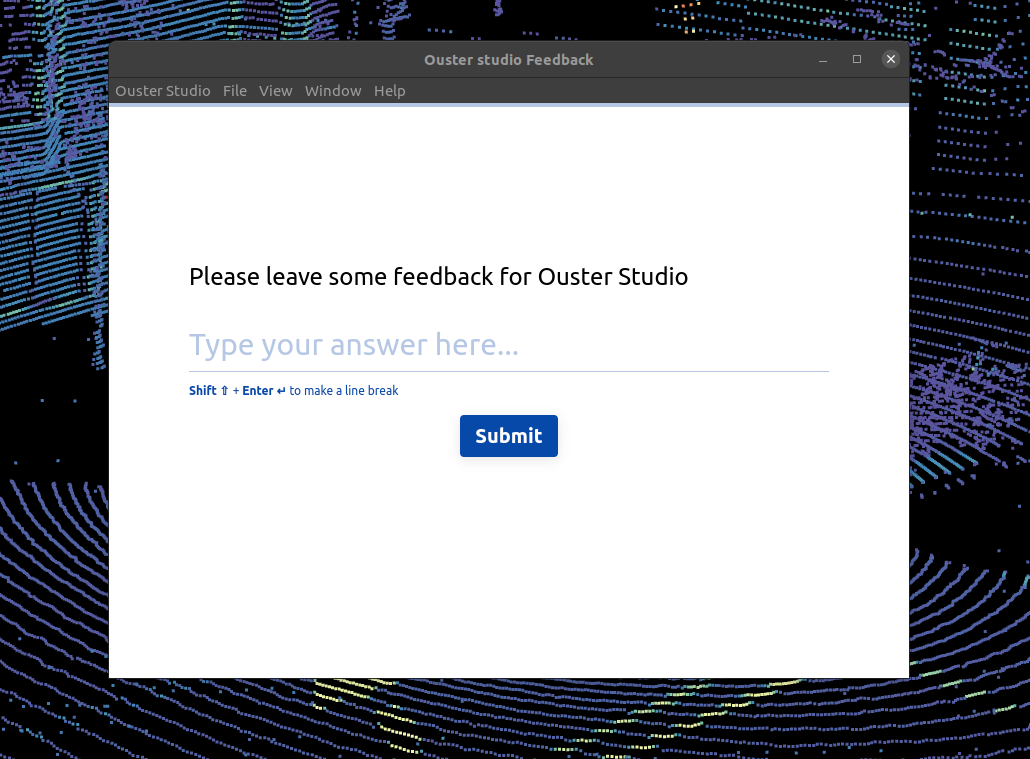
Fig. 21 Help & Feedback - Ouster Support
Left Pane
Left Pane comprises of the following:
Toolbar (File, View, Windows, Help)
Scene (3D Point cloud and 2D image)
Info (Sensor Configuration Information and Diagnostics)
Toolbar Includes:
File - User can access Live sensor, playback local recording.
View - Includes play/pause, increase/decrease playback speed and point size, etc.
Window - User can use this to maximize or minimize the window.
Help - User can either provide feedback or request Ouster support, this also includes easy access to quick start guide and Ouster sensor documentation.
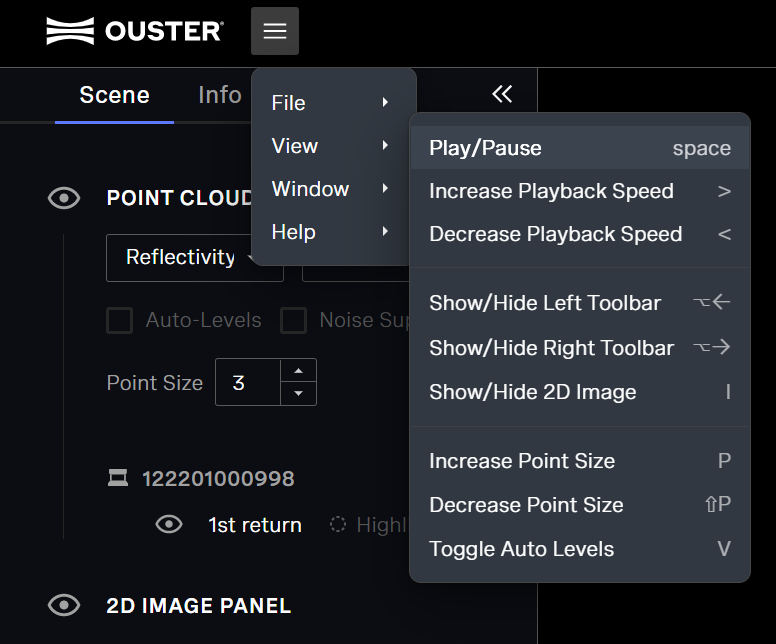
Fig. 22 Toolbar
Scene includes:
Invert Scene - Supports users with sensor installation where the scene is inverted or for sensors such as OSDome. Both 2D and 3D image in this case would be inverted for visualization.
Point Cloud - User can view point cloud based on
Reflectivity,Range,SignalorNear IRand canincreaseordecreasepoint size for better visuals.Auto-Levels: Augments the signal to have as much contrast as possible when displayed. Even if this distorts the actual absolute values it helps to emphasize the relative differences and helps distinguish finer details in the signal.Noise Suppression: To mitigate impact of difference in sensitivity of individual SPADs that manifest as horizontal streaks. This only affects the NEAR-IR channel field.Calibrated Reflectivity: Does not support Auto leveling since Ouster calibrates the sensors in the factory to have range of 256 values and have precise predefined values.
Highlighting returns based on
1st strongestand2nd strongest. User has the ability to choose a color (from the options provided) to highlight either of these returns.2D Image
Enable/Disable view.
Enable/Disable ruler.
Users can view 2D image based on
Reflectivity,Range,SignalorNear IRand can stack upto 3 2D image outputs for better visualization.
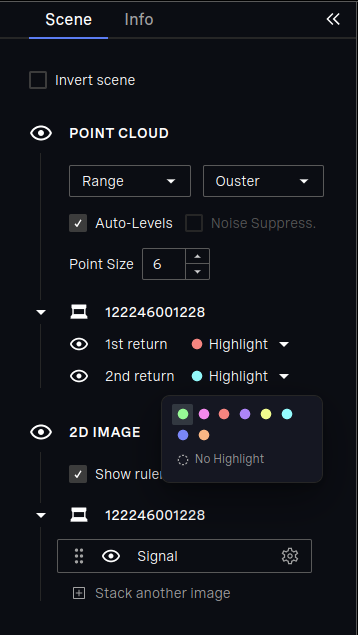
Fig. 23 Scene |
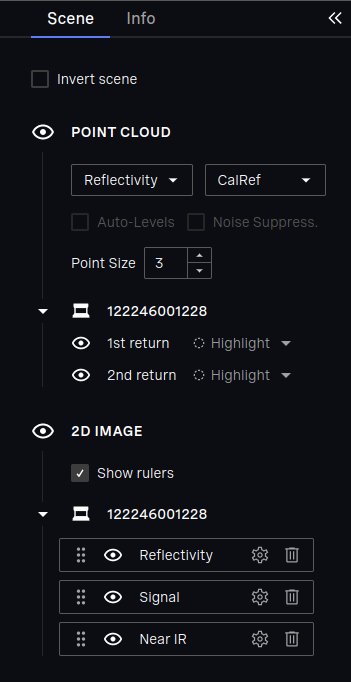
Fig. 24 Stack 2D Image |
Info includes:
Sensor Information : Sensor serial number, Model, Hardware version, Current Firmware and the status of the sensor.
Configuration: Lidar mode, Data Profile, Azimuth window and Signal Multiplier. User can click on
Advancedto access more parameters that can be configured.Active Alerts:
Diagnostics pagethat will display all the active and logged alerts, user can use this to determine if there is an action to be taken.
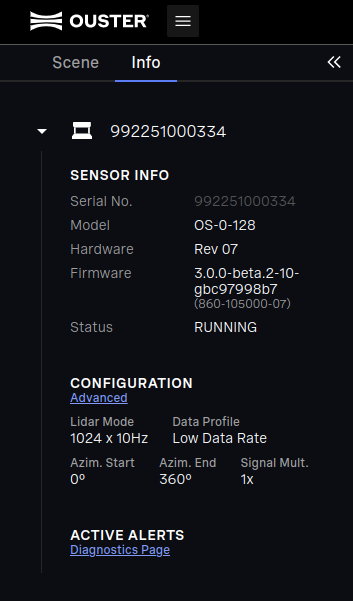
Fig. 25 Information
Center Pane
Center Pane comprises of the following:
2D Visualizer: User can click on the settings icon to access more options to view the data in Range, Signal, Near IR or Reflectivity.
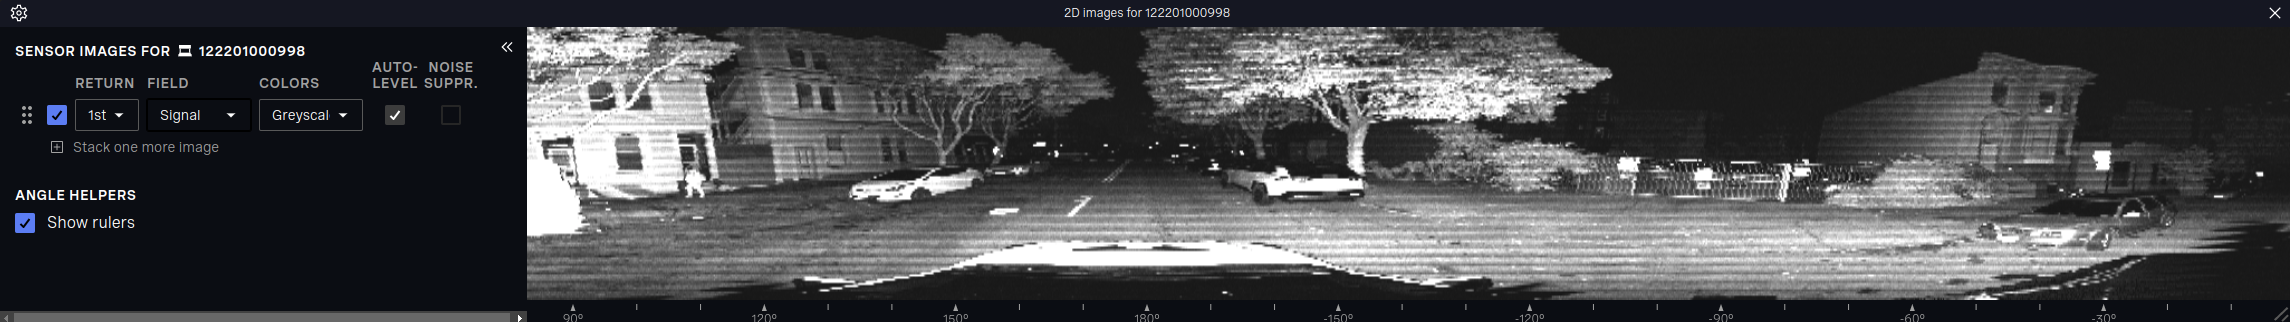
Fig. 26 2D Visualizer
3D Point Cloud
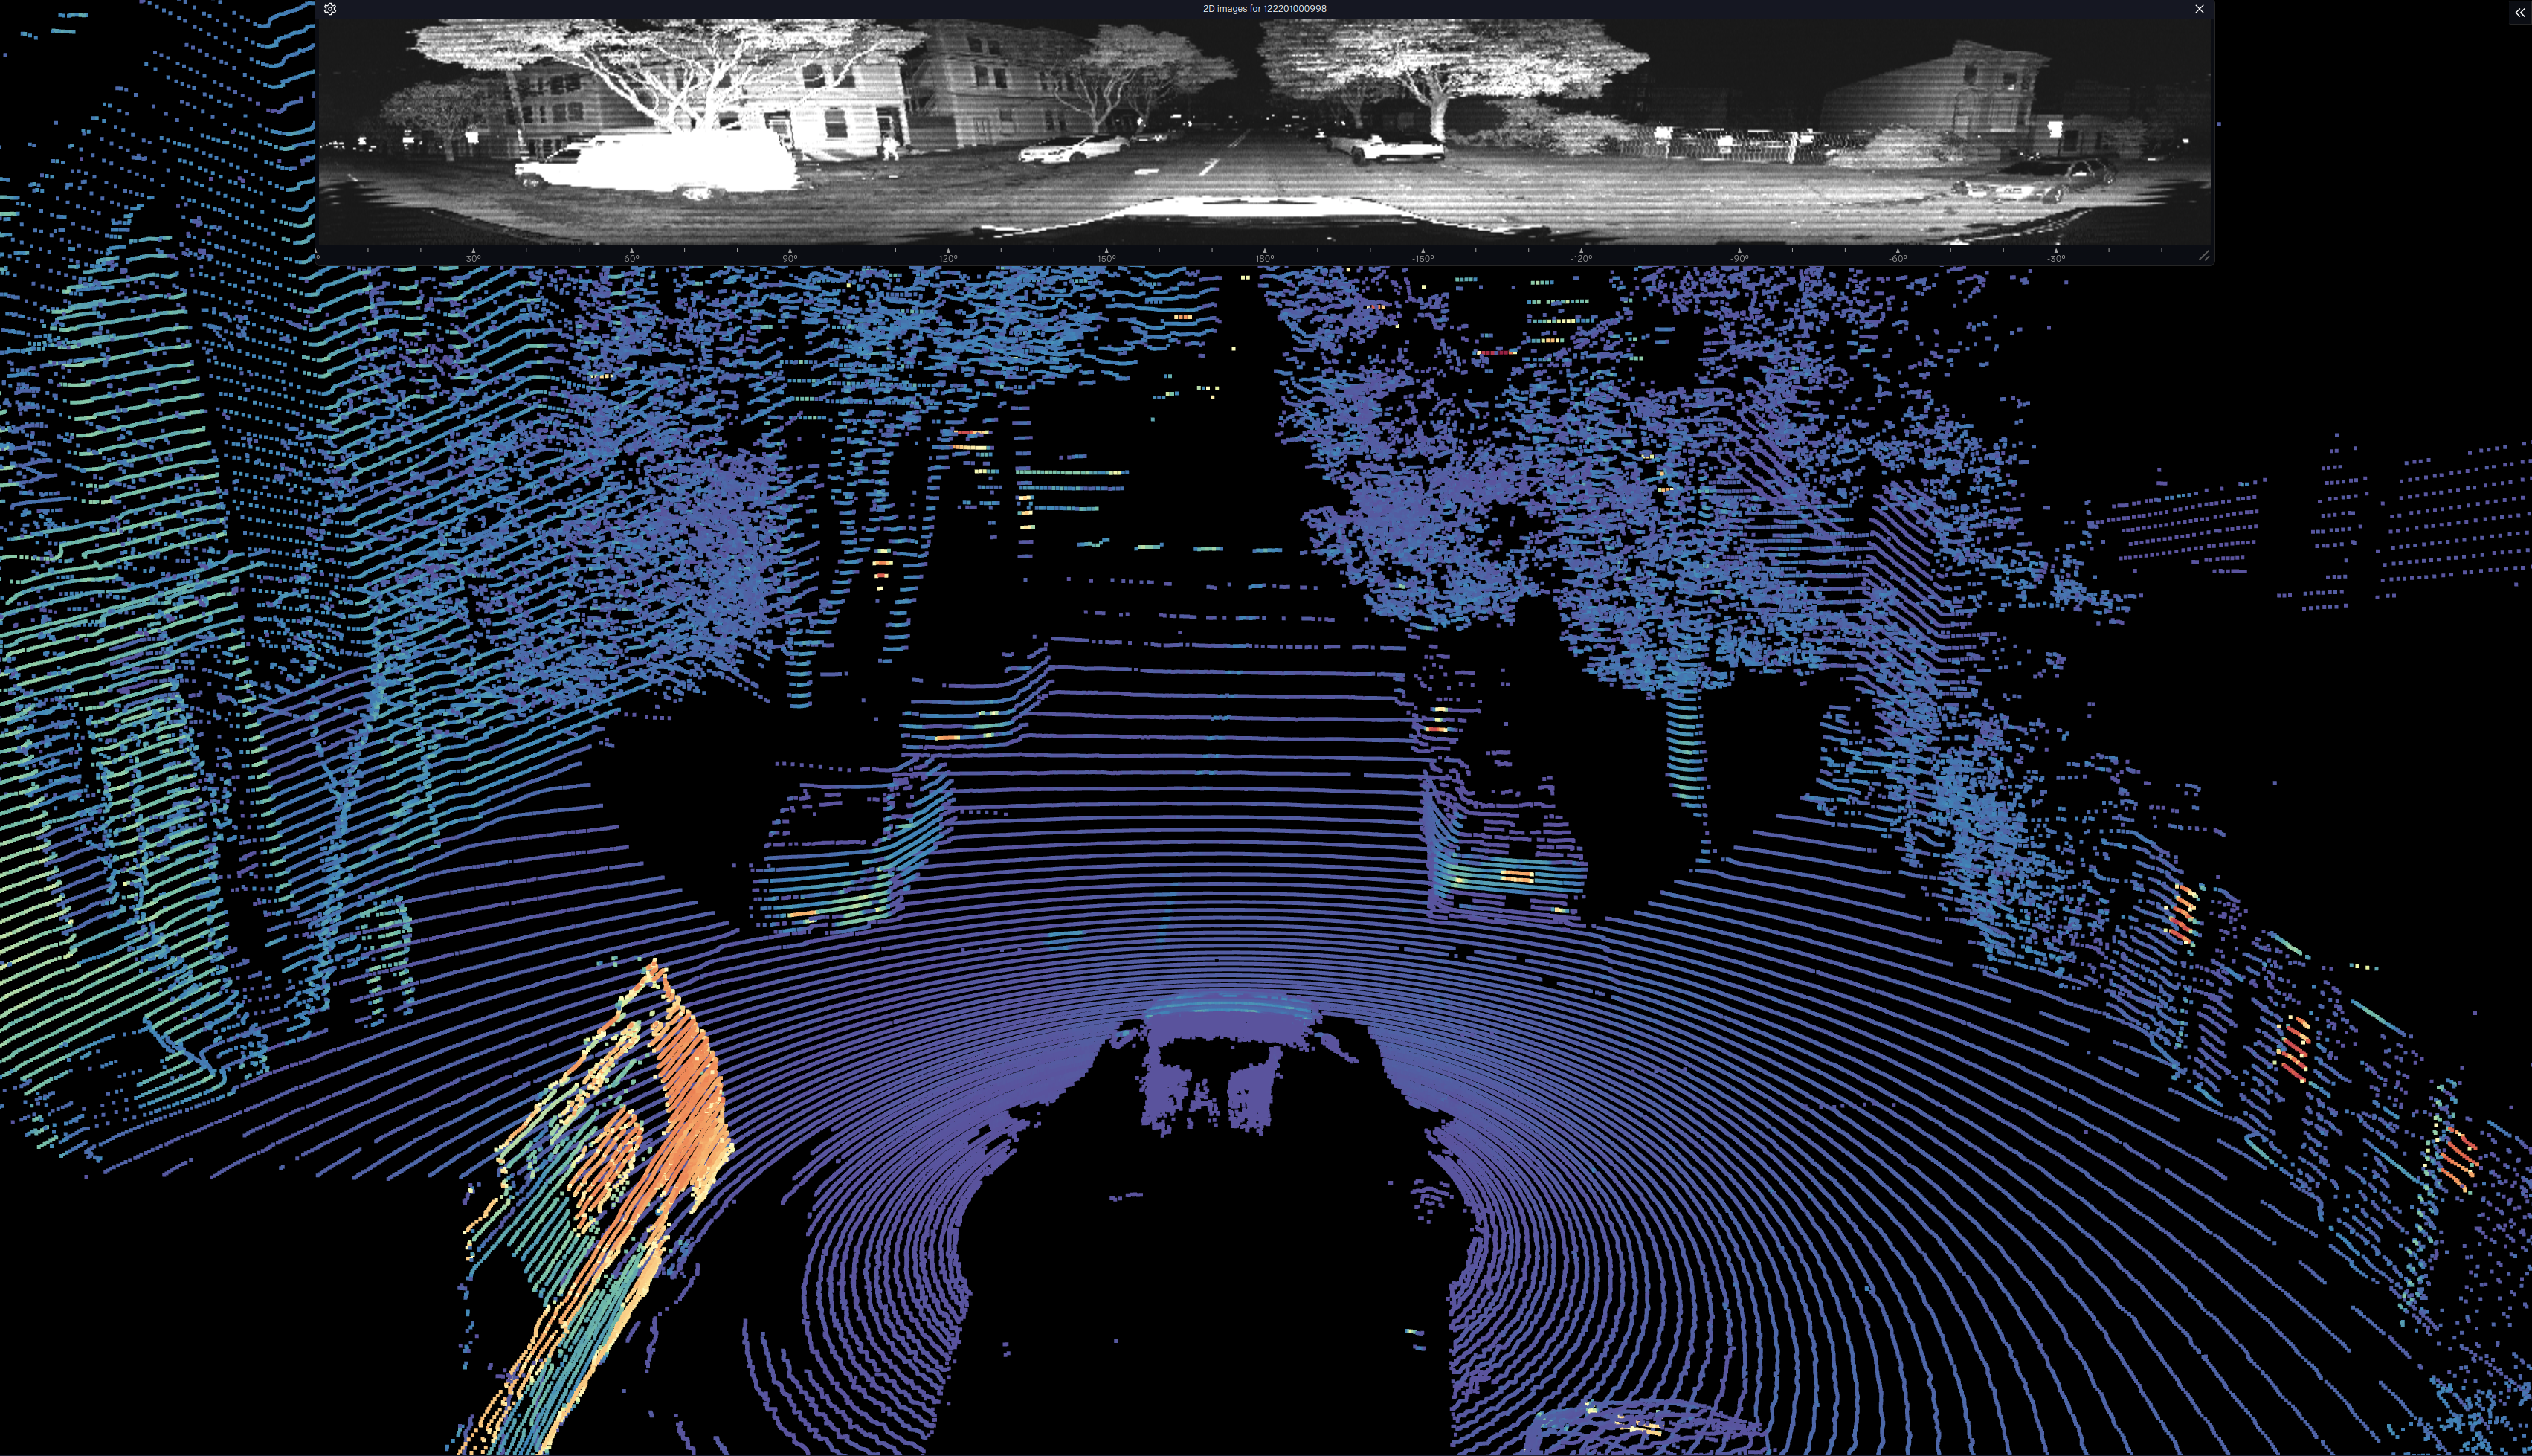
Fig. 27 3D Point Cloud
Footer
Footer comprises of a play bar that includes play and pause when the user is playing back a pre-recorded .pcap file or live streaming a sensor. Record tab is also available when visualizing a live sensor giving the user an option to record data when needed.

Fig. 28 Record Data
Right Pane
Right pane comprises of the Export tab. User can choose the number of rows, columns, single return or dual return and number of frames to be exported in the form of a .csv file.
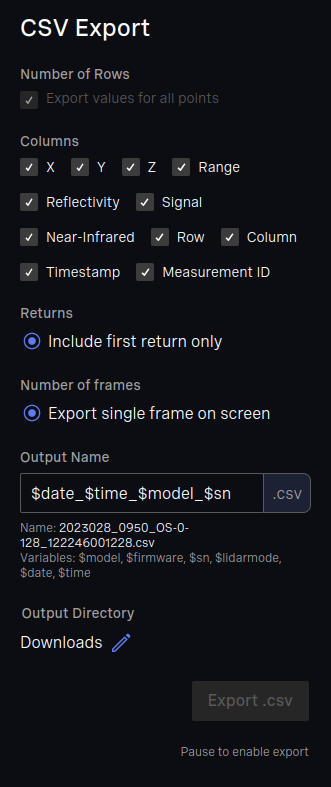
Fig. 29 Right Pane