Point Cloud Visualizer
The Ouster visualization toolkit is written in C++ with Python bindings for Python functionality. It consists of the following:
simple-viz(viz.SimpleViz): the default Python application visualizer, which can also be used as an entrypoint for more sophisticated custom point cloud visualizationsouster_viz: the core C++ libraryouster.sdk.viz: the Python module for the bindings
simple-viz is a fastest way to visualize data from a connected sensor or a recorded pcap:
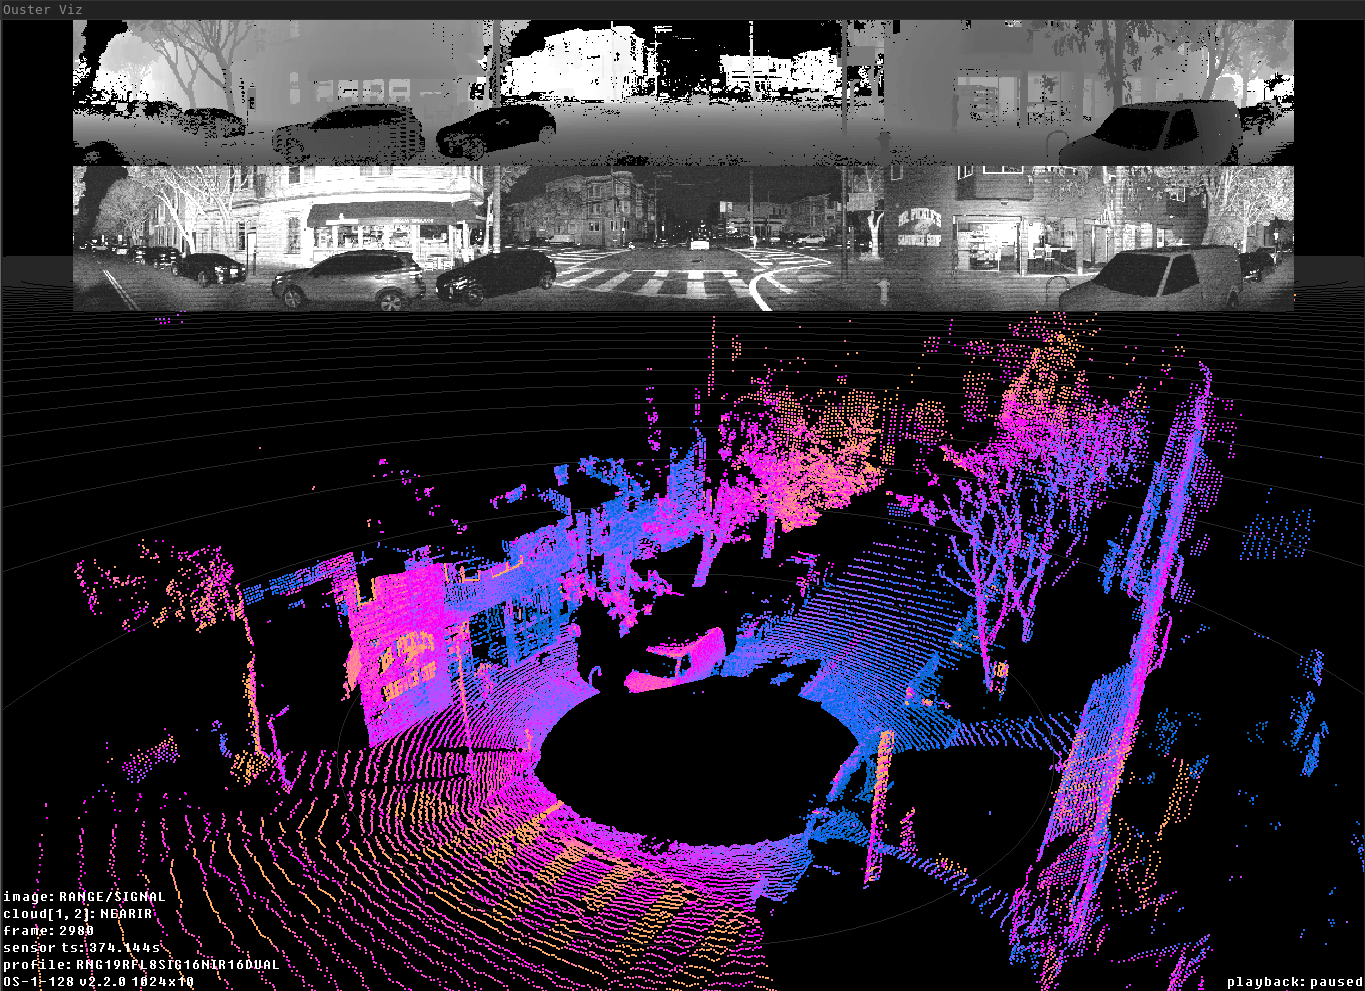
Ouster simple-viz visualization of OS1 128 sample data
How to use simple-viz you can learn in Running the Ouster visualizer
For custom visualizations you can explore a programmatically accessible viz.PointViz API
below:
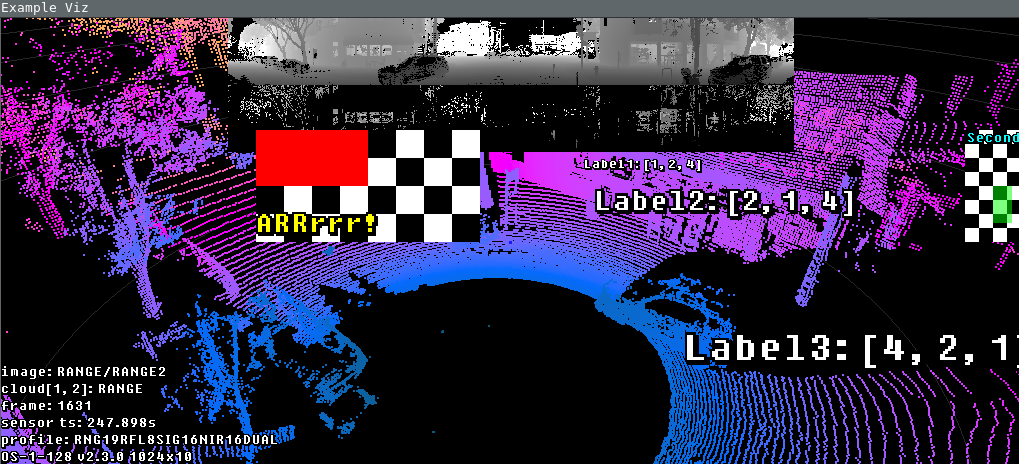
PointViz with Image, Label and masks applied