Visualize SLAM Poses using ScansAccumulator - accumulates track, point clouds and map views
Overview
ScansAccumulator is the continuation of the efforts to view the lidar data with poses that may
come within the LidarScan.pose property. When poses are not present in the LidarScan
ScansAccumulator may still be useful to view the accumulated N scans from the live
sensor/recording and reveal the accuracy/repeatability of the data.
Available view modes
There are three view modes of ScansAccumulator, that may be enabled/disabled depending on it’s params and the data that is passed throught it:
poses (or TRACK), key
8- all scan poses in a trajectory/path view (available only if poses data is present in scans)scan map (or MAP), key
7- overall map view with select ratio of random points from every scan (available for scans with/without poses)scan accum (or ACCUM), key
6- accumulated N scans (key frames) that is picked according to params (available for scans with/without poses)
Key bindings
Keyboard controls available with ScansAccumulator:
Key
What it does
6Toggle scans accumulation view mode (ACCUM)
7Toggle overall map view mode (MAP)
8Toggle poses/trajectory view mode (TRACK)
k / KCycle point cloud coloring mode of accumulated clouds or map
g / GCycle point cloud color palette of accumulated clouds or map
j / JIncrease/decrease point size of accumulated clouds or map
Use in Ouster SDK CLI
ScansAccumulator is present in every CLI viz call, no matter the source of data or way of
calling it.It’s in live sensor viz, pcap record --viz, osf viz, mapping viz and
pcap viz as well as all source SOURCE versions of those commands. Everywhere the same set of
CLI parameters control the behavior of the ScansAccumulator.
Works for data sources with/without poses:
--accum-num N- accumulate N scans (default:0)
--accum-every K- accumulate every Kth scan (default:1)
--accum-every-m M- accumulate a scan every Mth meters traveled (default:None)
--accum-map- enable the overall map accumulation, select some percentage of points from every scan (default: disabled)
--accum-map-ratio R- set R as a ratio of points to randomly select from every scan (default:0.001(0.1%))
Examples of the CLI commands:
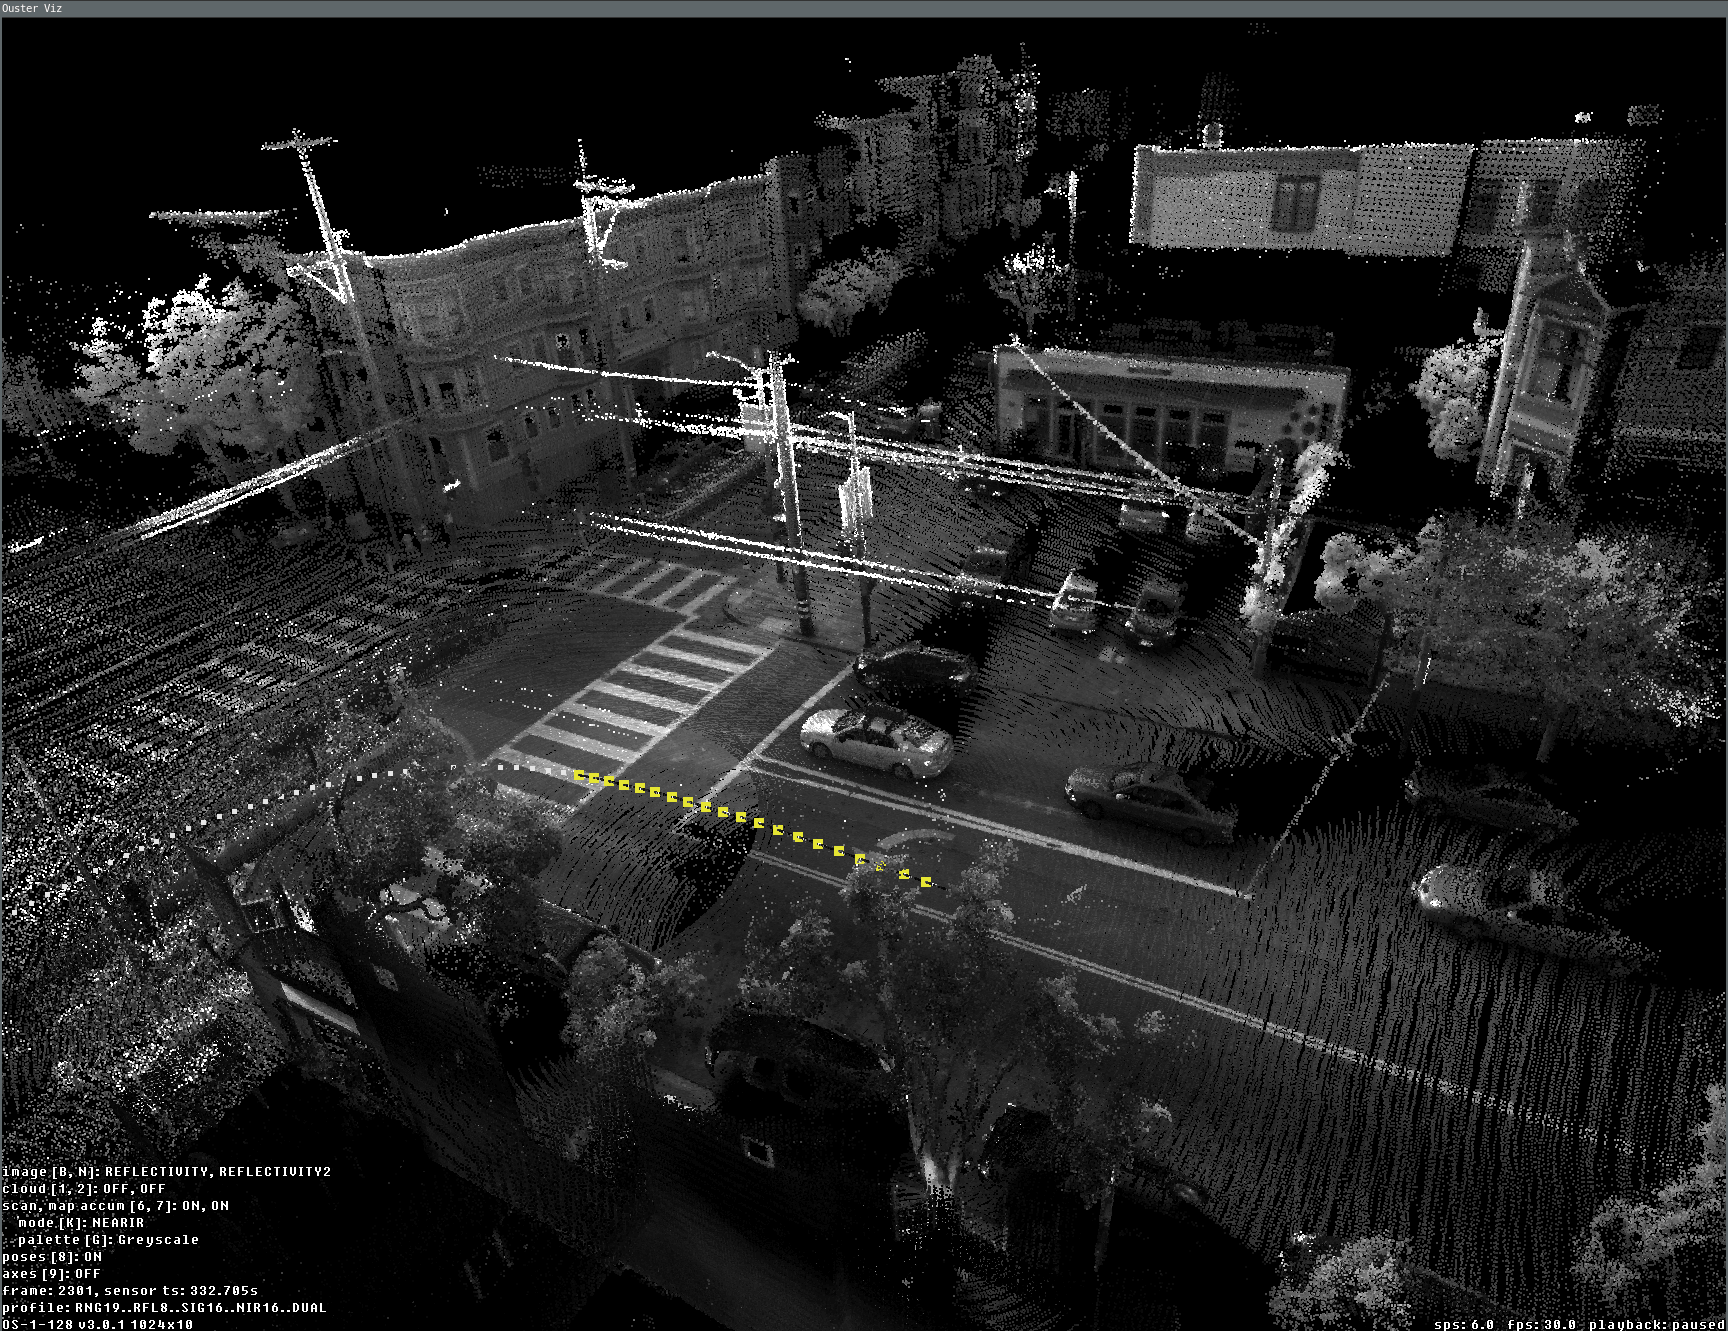
Dense accumulated clouds view (with every point of a scan)
To obtain the densest view use the --accum-num N --accum-every 1 params where N is the
number of clouds to accumulate (N up to 100 is generally small enough to avoid slowing down the
viz interface):
ouster-cli source OS-1-128_v3.0.1_1024x10_20230216_142857-000.pcap slam viz --accum-num 20
and the dense accumulated clouds result:

Dense view of 20 accumulated scans during the slam viz run
Overall map view (with poses)
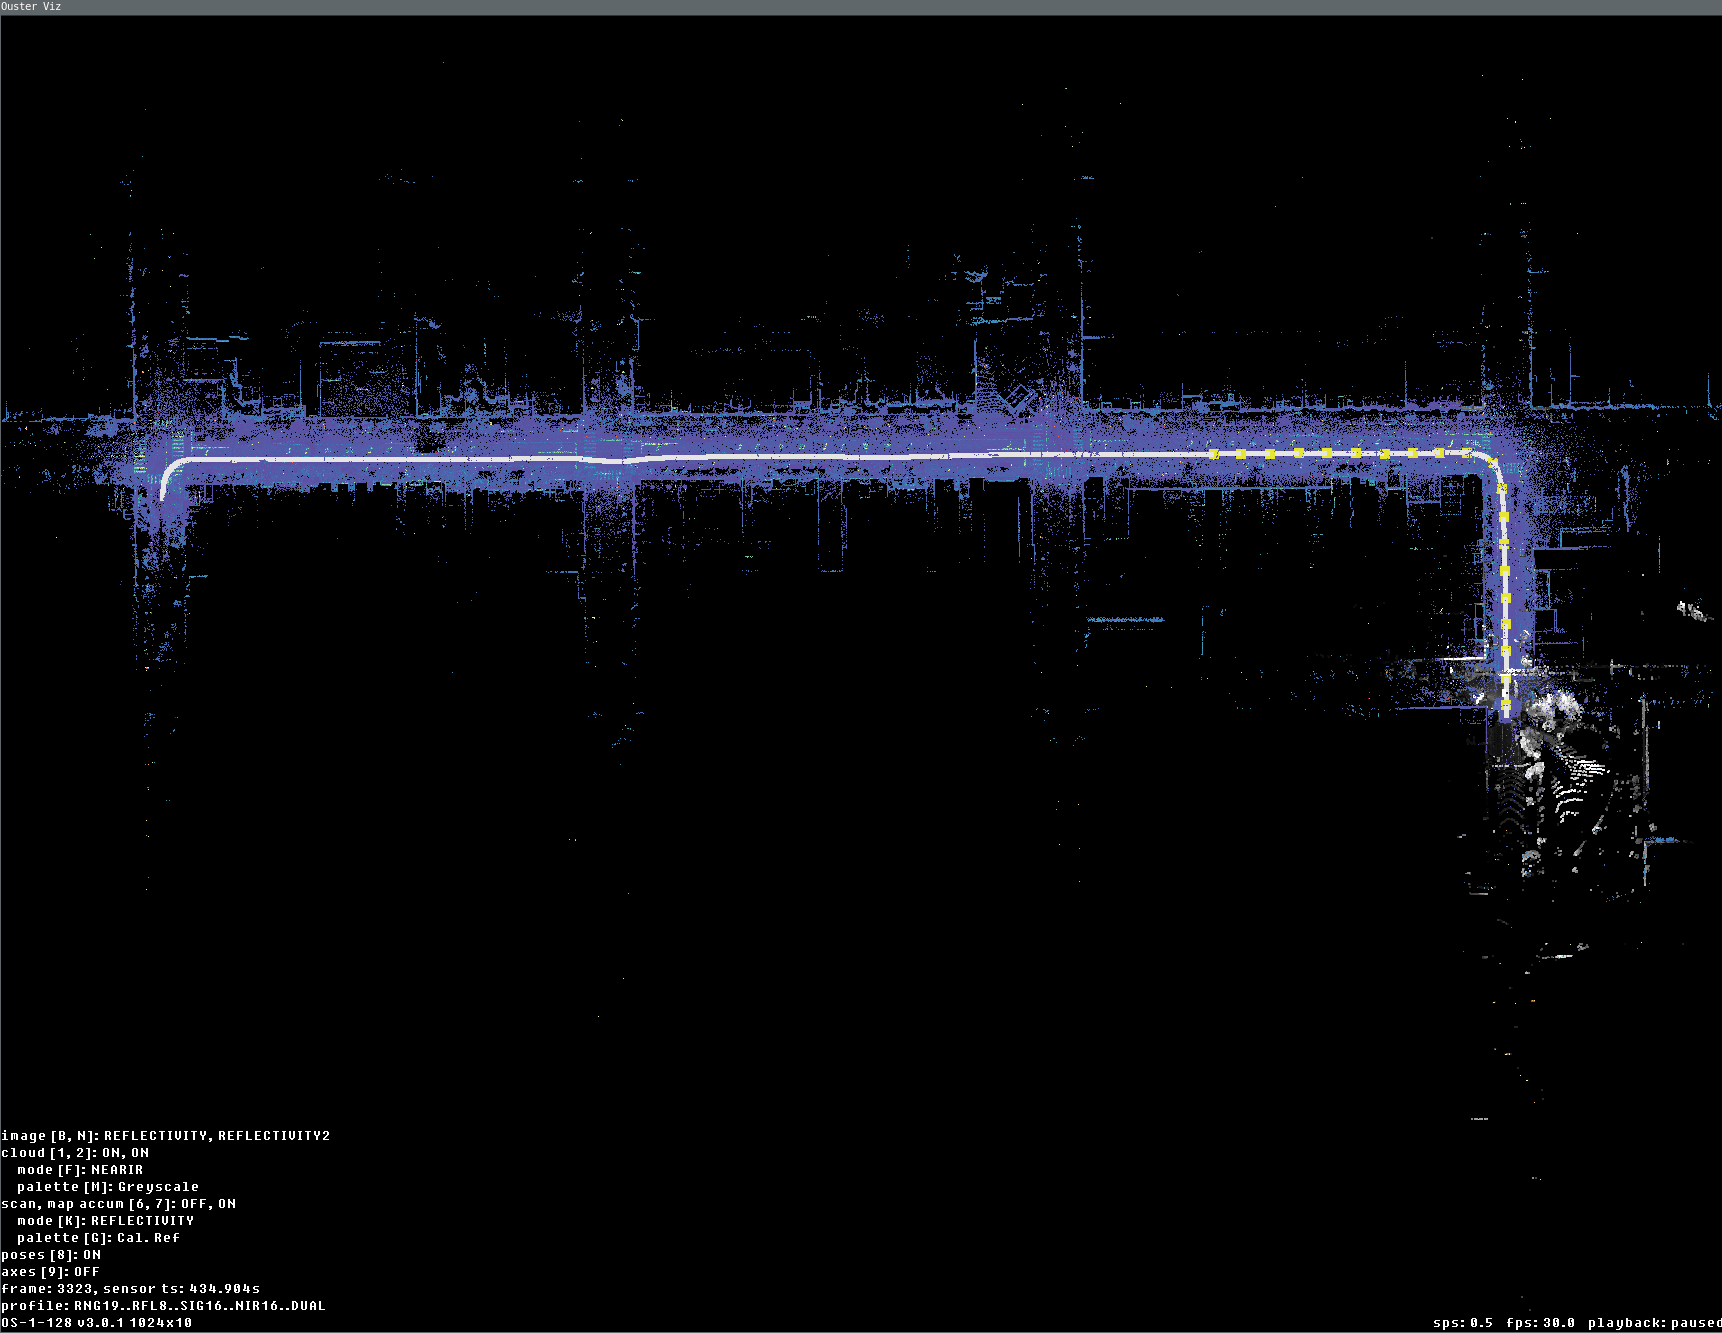
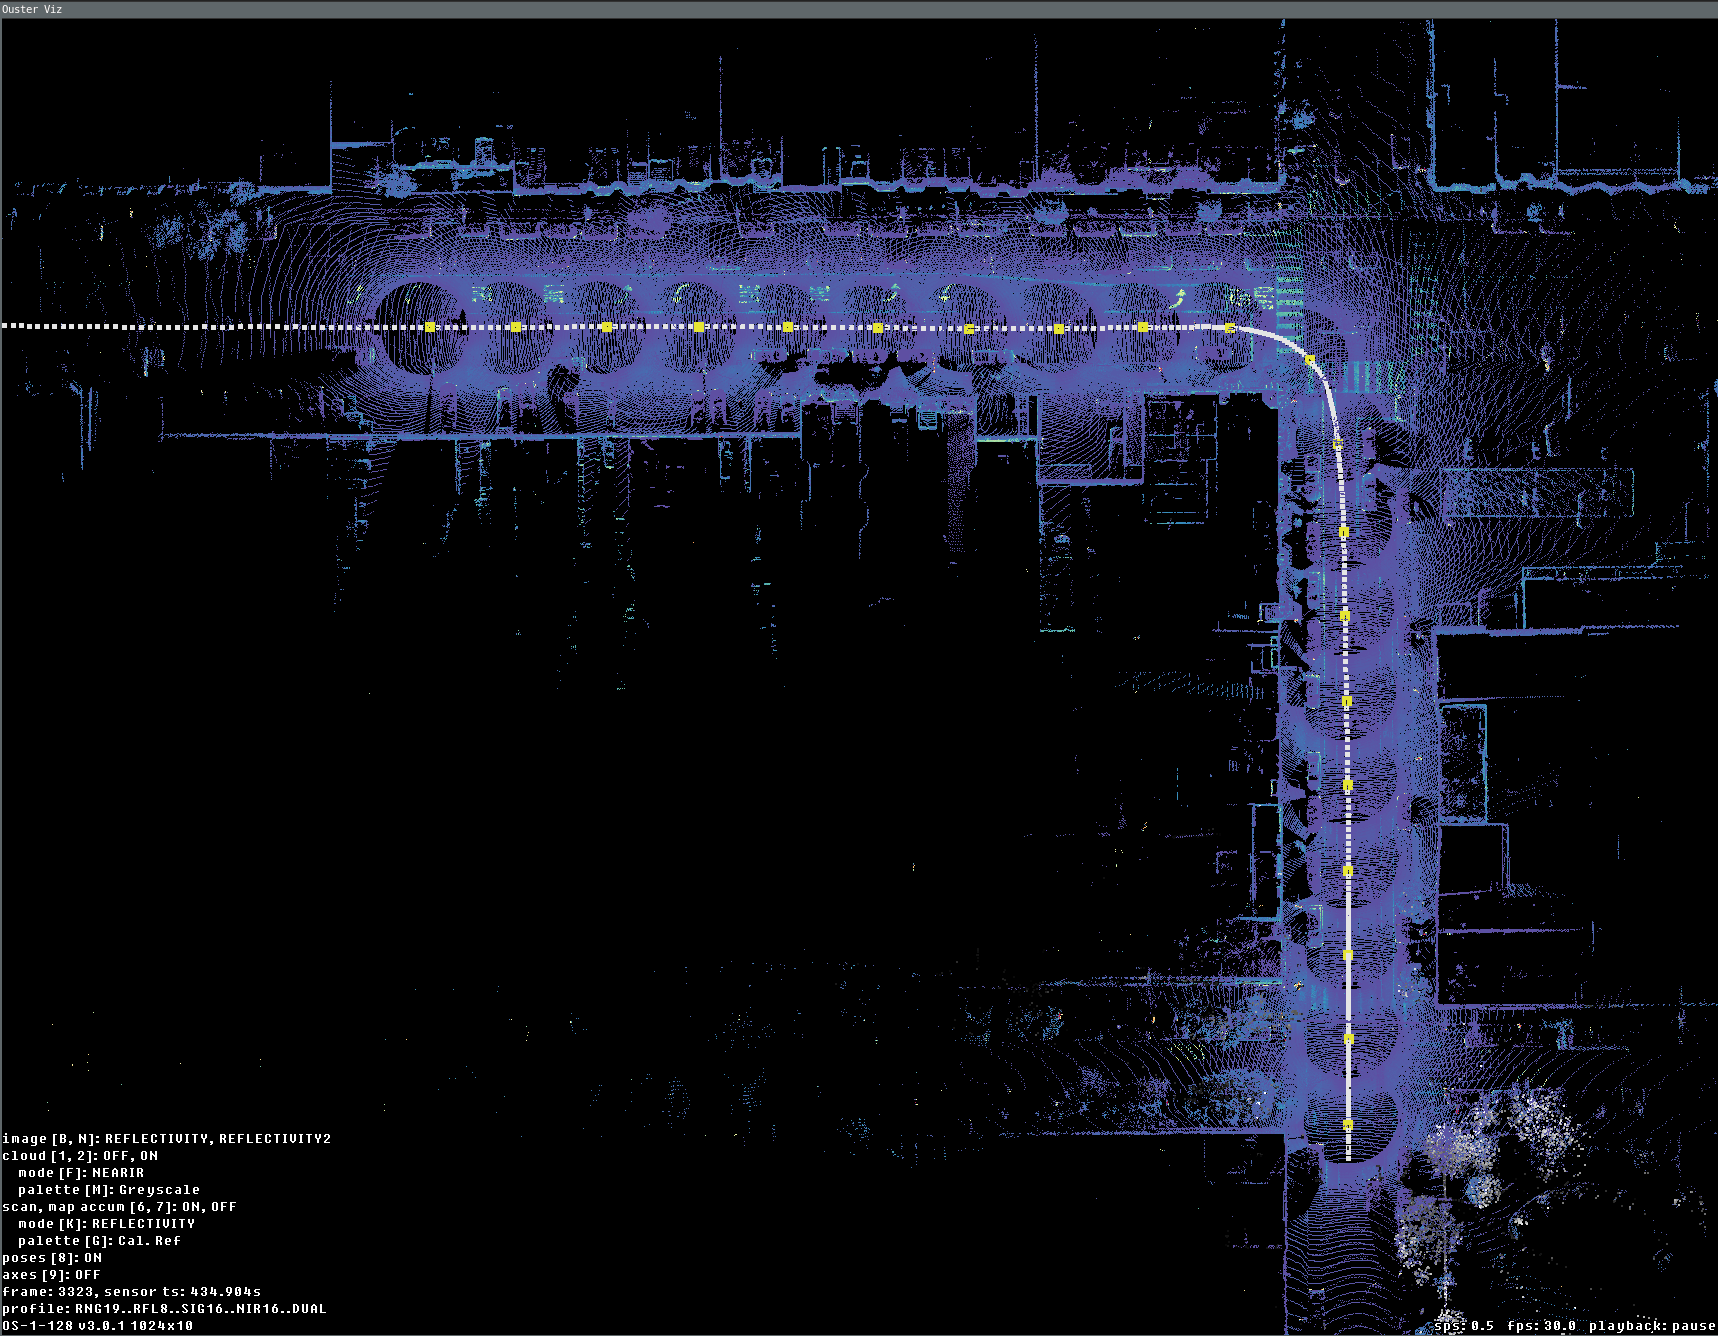
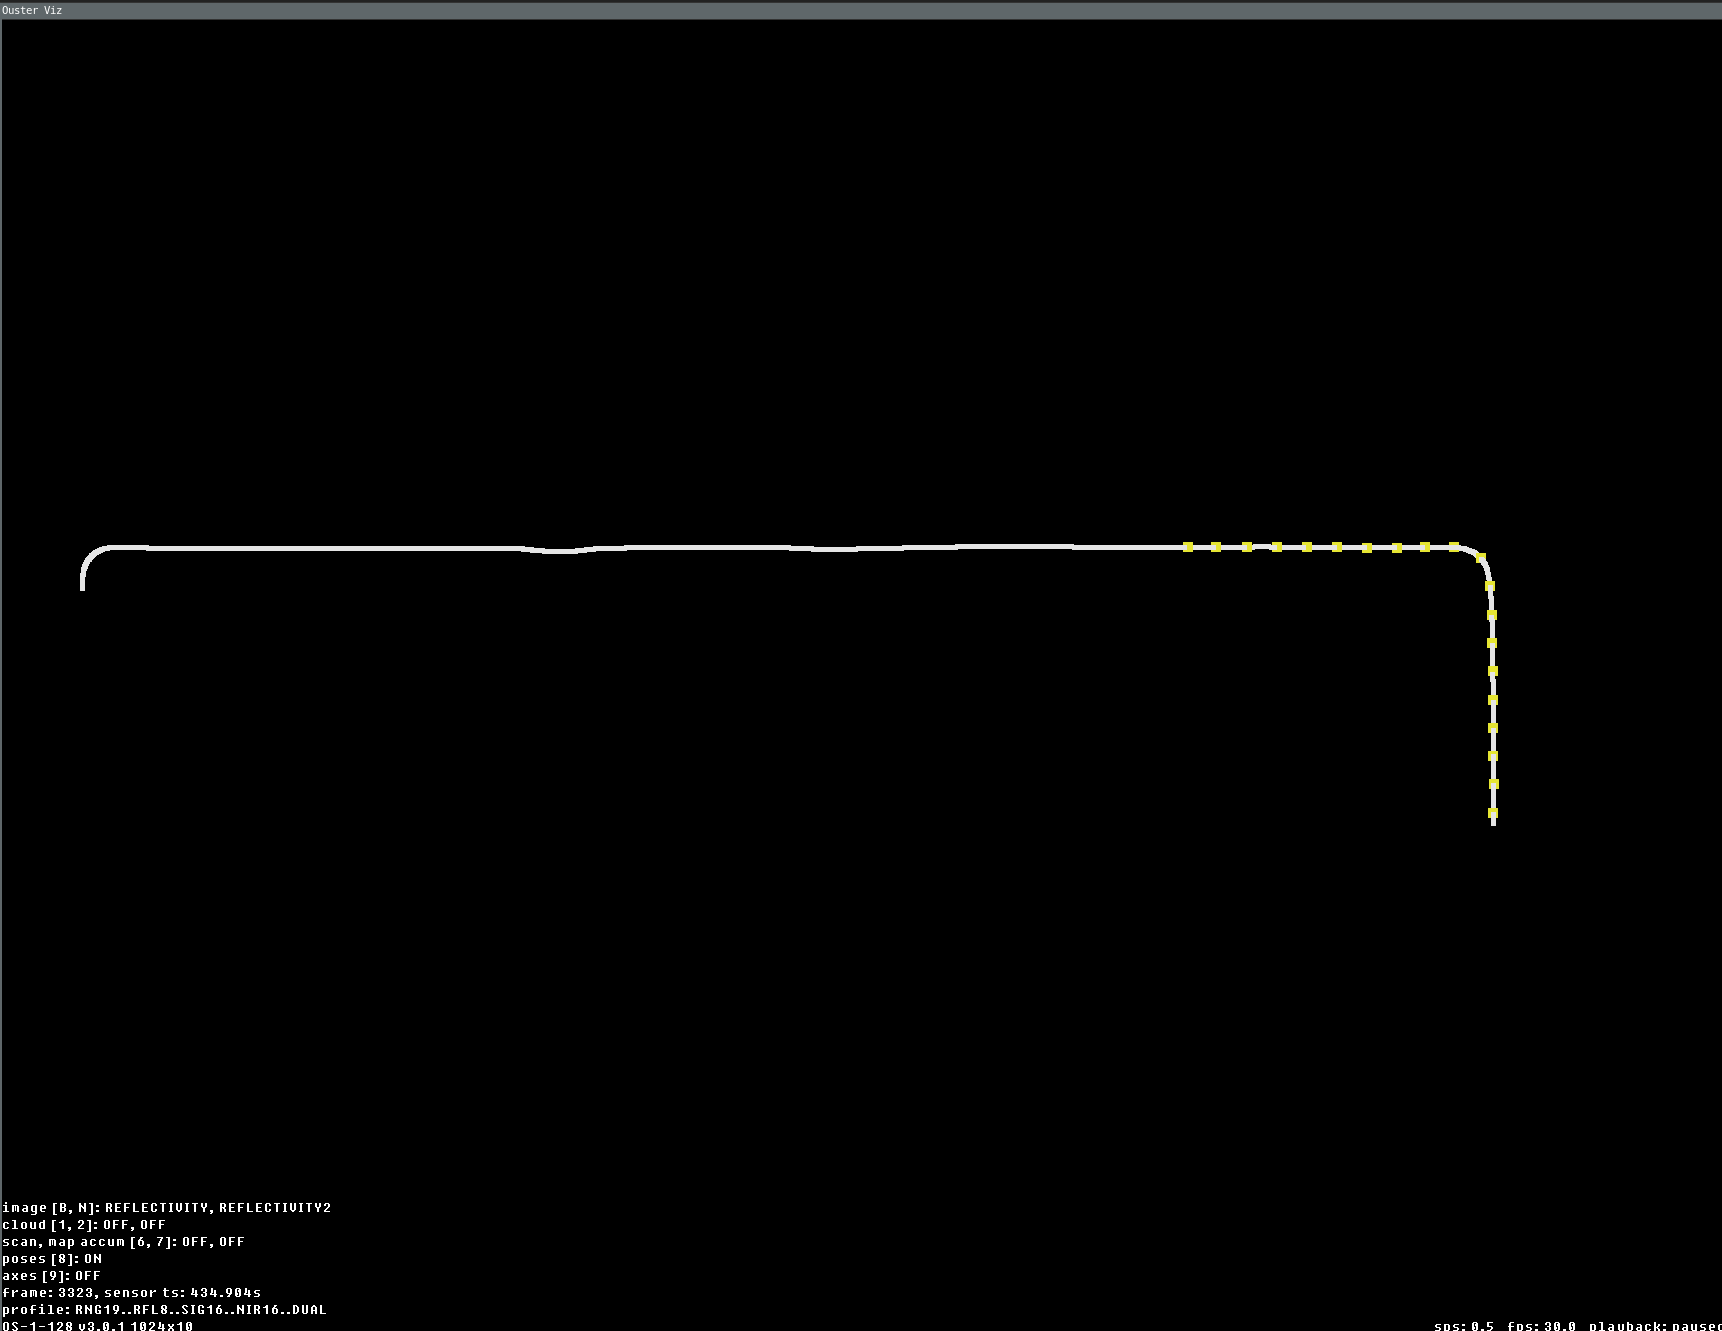
One of the main task that we often needed was a preview of the overall map from the OSF with poses for example:
ouster-cli osf viz OS-0-128_v3.0.1_1024x10_20230415_152307-000.osf --accum-num 20 \
--accum-every 0 --accum-every-m 10.5 --accum-map -r 0 -e stop
And here is the final result when viz is done and stopped (-e stop) after playing the whole file:

Data fully replayed with map and accum enabled (last current scan is displayed here in grey palette)

Data fully replayed with view only last 20 scans accumulated every 10.5 meters

Data fully replayed with view of only trajectory (yellow knobs is 20 accumulated key frames positions)
Programmatic use with (and without) PointViz
With point_viz: PointViz object the ScansAccumulator can be used as a regular
LidarScanViz and passed directly to SimpleViz:
from ouster.viz import PointViz, add_default_controls, ScansAccumulator

point_viz = PointViz("SimpleViz usecase")
add_default_controls(point_viz)

# ... get scans_w_poses Scans source ...

scans_acc = ScansAccumulator(meta,
                             point_viz=point_viz,
                             accum_max_num=10,
                             accum_min_dist_num=1,
                             map_enabled=True,
                             map_select_ratio=0.5)

SimpleViz(scans_acc, rate=1.0).run(scans_w_poses)
Alternatively with a PointViz it can be used as a canvas to draw the final state only:
from ouster.viz import ScansAccumulator, add_default_controls, PointViz

point_viz = PointViz("Overall map case")
add_default_controls(point_viz)

# ... get scans_w_poses Scans source ...

scans_acc = ScansAccumulator(meta,
                             point_viz=point_viz,
                             accum_max_num=10,
                             accum_min_dist_num=1,
                             map_enabled=True,
                             map_select_ratio=0.5)

for scan in scans_w_poses:
    scans_acc.update(scan)

scans_acc.draw(update=True)
point_viz.upadte()
point_viz.run()
Without PointViz it can be used as in the following snippet to accumulate all data and use the
data later to draw anywhere (here we still use the PointViz and viz.Cloud() as a main
graphing tool, but it can be matplotlib instead):
from ouster.viz import grey_palette, ScansAccumulator, Cloud, add_default_controls, PointViz

# ... get scans_w_poses Scans source ...

# create scans accum without PointViz
scans_acc = ScansAccumulator(meta,
                             map_enabled=True,
                             map_select_ratio=0.5)

# processing doesn't require viz presence in scans accum
for scan in scans_w_poses:
    scans_acc.update(scan)

point_viz = PointViz("Standalone case")
add_default_controls(point_viz)

# draw the cloud manually to the viz using ScansAccumulator MAP data
cloud_map = Cloud(scans_acc._map_xyz.shape[0])
cloud_map.set_xyz(scans_acc._map_xyz)
cloud_map.set_key(scans_acc._map_keys["NEAR_IR"])
cloud_map.set_palette(grey_palette)
cloud_map.set_point_size(1)
point_viz.add(cloud_map)
In the example above one might use matplotlib with some modifications to use palette for picking
the key color.