Running the Ouster visualizer
After installing the ouster-sdk package, you can run:
$ simple-viz --sensor <sensor hostname>
where <sensor hostname> is the hostname (os-99xxxxxxxxxx) or IP of the sensor.
Alternately, to replay the existing data from pcap and json files call the visualizer as:
$ simple-viz --pcap <pcap_path> [--meta <meta_path>]
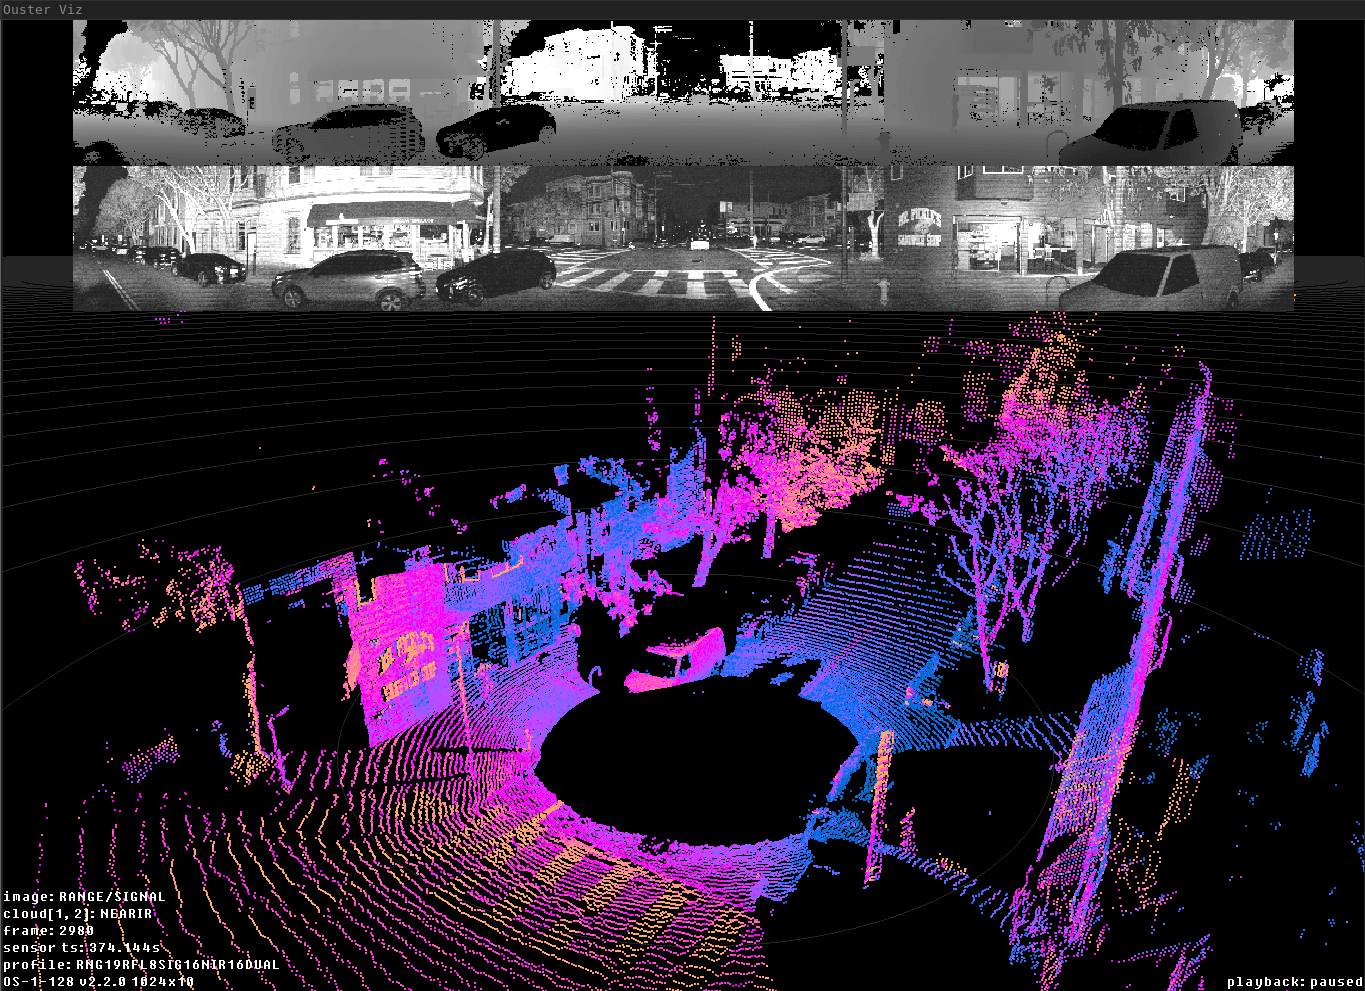
Ouster simple-viz visualization of OS1 128 sample data
The sample visualizer does not currently include a GUI, but can be controlled with the mouse and keyboard:
Click and drag rotates the view
Middle click and drag moves the view
Scroll adjusts how far away the camera is from the vehicle
- Keyboard controls:
Key
What it does
oToggle on-screen display
p/PIncrease/decrease point size
mCycle point cloud coloring mode
bCycle top 2D image
nCycle bottom 2D image
RReset camera
e/EIncrease/decrease size of displayed 2D images
'/"Increase/decrease spacing in range markers
wCamera pitch up
sCamera pitch down
aCamera yaw left
dCamera yaw right
1Toggle first return point cloud visibility
2Toggle second return point cloud visibility
0Toggle orthographic camera
=/-Dolly in/out
(space)Toggle pause
./,Step one frame forward/back
ctrl + ./,Step 10 frames forward/back
>/<Increase/decrease playback rate (during replay)
shiftCamera Translation with mouse drag
For usage and other options, run simple-viz -h
Note
All basic primitives that you see as part of simple-viz visualizer are exposed through
viz.PointViz bindings. Please see PointViz Tutorial & API Usage for how to use it
programmatically in Python.
Advanced usage with sensor
The Ouster visualizer automatically configures connected sensors to send data to the appropriate udp
destination address. If your sensor is already configured appropriately, you may find it useful to
use the argument --no-auto-dest to save time by skipping the roundtrip to reconfigure the
sensor.