Running the Ouster visualizer
After installing the ouster-sdk package, you can run:
$ ouster-cli source <sensor hostname> viz
where <sensor hostname> is the hostname (os-99xxxxxxxxxx) or IP of the sensor.
Alternately, to replay the existing data from pcap and json files call the visualizer as:
$ ouster-cli source <pcap_path> [--meta <meta_path>] viz
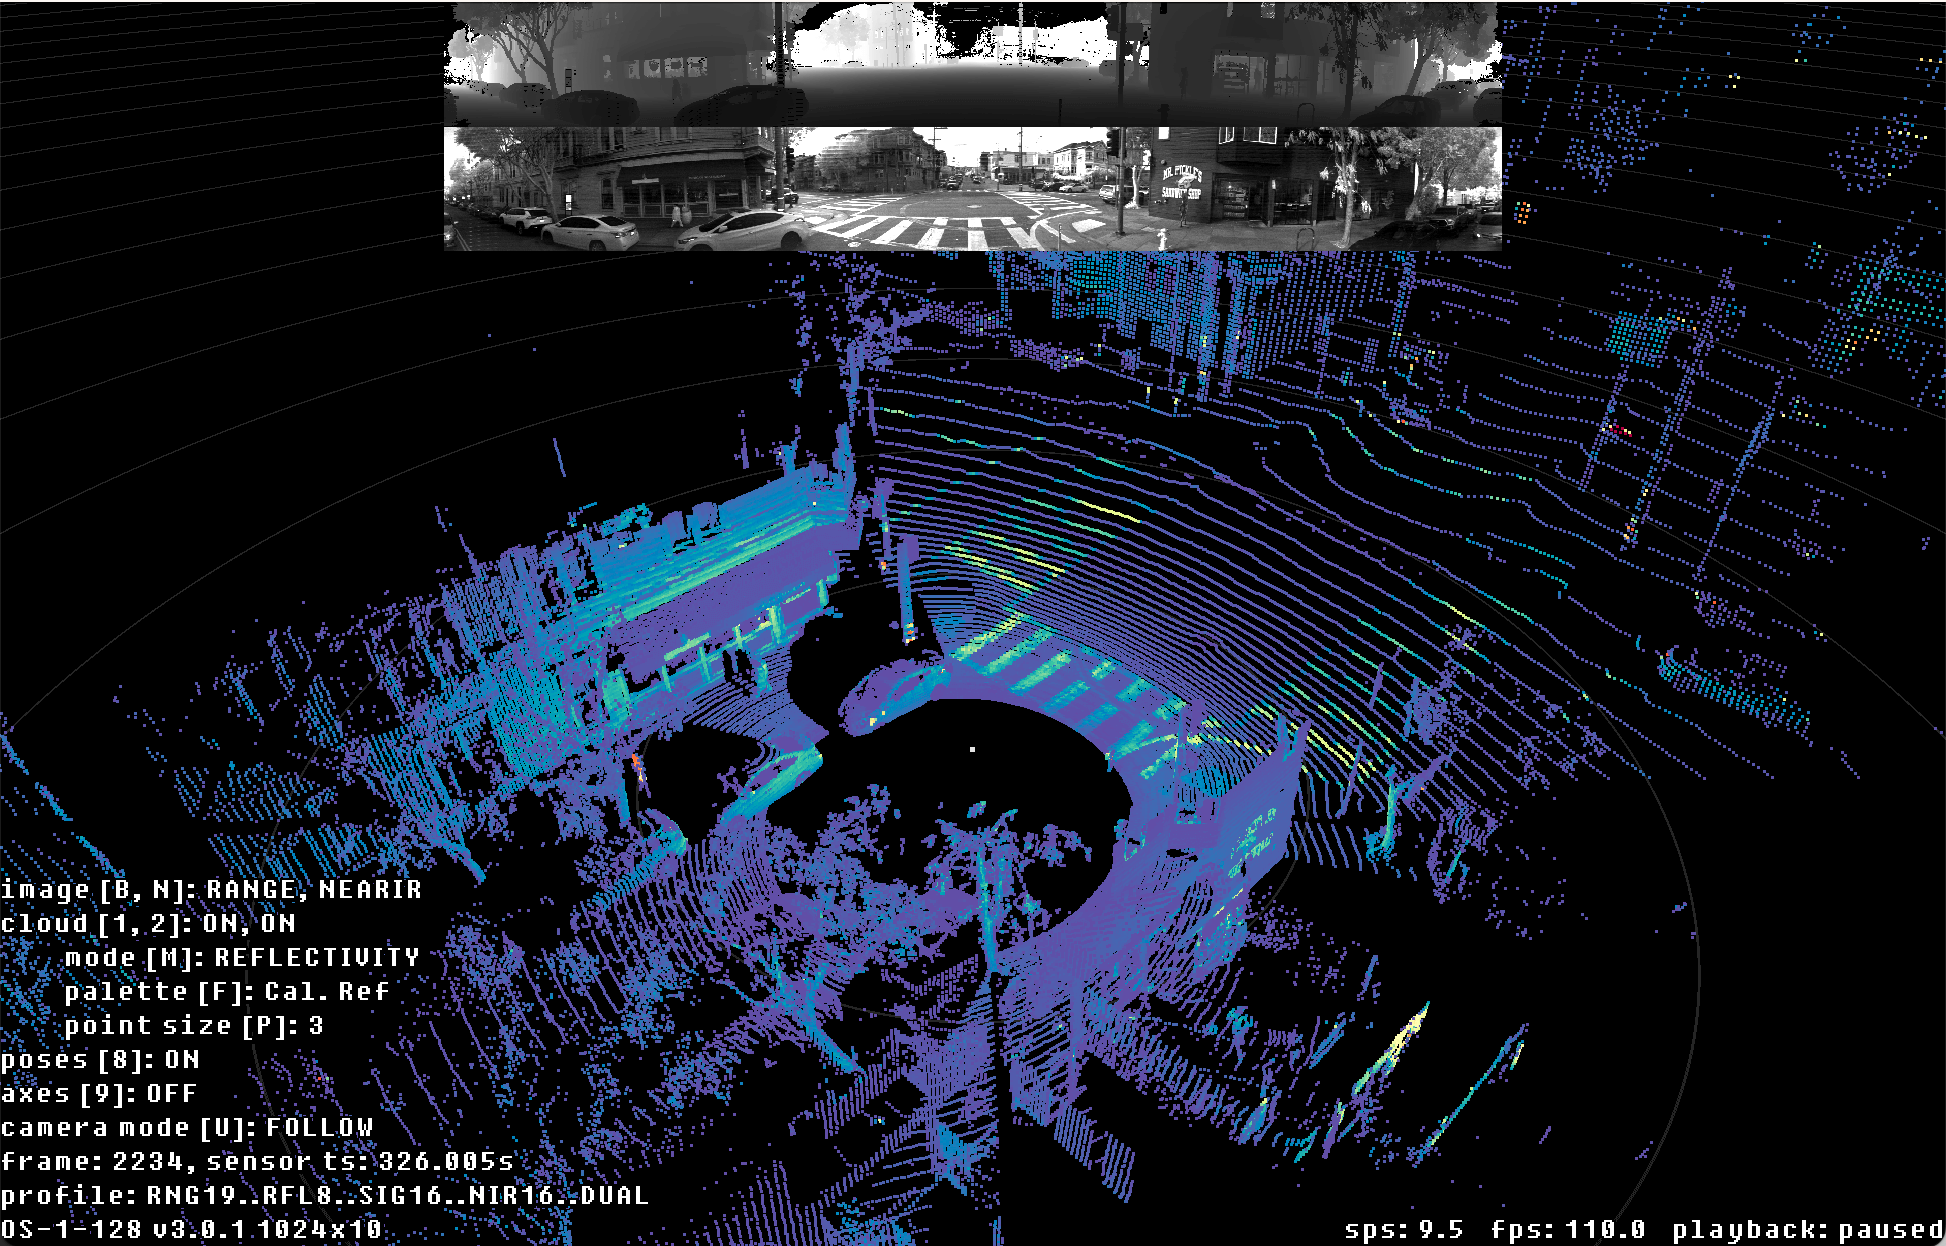
Ouster SDK CLI ouster-cli source <sensor | pcap | osf> viz visualization of OS1 128 sample data
The Ouster SDK CLI visualizer does not include a GUI, but can be controlled with the mouse and keyboard:
Click and drag rotates the view
Middle click and drag moves the view
Scroll adjusts how far away the camera is from the vehicle
- Keyboard controls:
Key
What it does
oToggle on-screen display
p / PIncrease/decrease point size
m / MCycle point cloud coloring mode
f / FCycle point cloud color palette
b / BCycle top 2D image
n / NCycle bottom 2D image
RReset camera
ctr-rSet camera to the birds-eye view
uToggle camera mode FOLLOW/FIXED
e / EIncrease/decrease size of displayed 2D images
' / "Increase/decrease spacing in range markers
wCamera pitch up
sCamera pitch down
aCamera yaw left
dCamera yaw right
1Toggle first return point cloud visibility
2Toggle second return point cloud visibility
0Toggle orthographic camera
= / -Dolly in/out
?Prints key bindings
spaceToggle pause
escExit visualization
. / ,Step one frame forward/back
ctrl + . / ,Step 10 frames forward/back
> / <Increase/decrease playback rate (during replay)
shiftCamera Translation with mouse drag
shift+zSave a screenshot of the current view
shift+xToggle a continuous saving of screenshots
?Print keys to standard out
The visualizer also includes an option to control the orientation of the point cloud in space when
loaded. If you possess, say, an OS-DOME mounted an upside down, you can start the visualizer with
the option --extrinsics:
$ ouster-cli source 10.0.0.13 viz --extrinsics -1 0 0 0 0 1 0 0 0 0 -1 0 0 0 0 1
The input is a row-major homogenous matrix.
For other options, run ouster-cli source <sensor | pcap | osf> viz -h
Note
All basic primitives that you see as part of ouster-cli visualizer are exposed through
viz.PointViz bindings. Please see PointViz Tutorial & API Usage for how to use it
programmatically in Python.
Advanced usage with sensor
The Ouster visualizer automatically configures connected sensors to send data to the appropriate udp
destination address. If your sensor is already configured appropriately, you may find it useful to
use the argument --no-auto-dest to save time by skipping the roundtrip to reconfigure the
sensor.