VIEWER
Layout
Ouster Gemini Detect Viewer Layout divided into five areas: Header, Left Pane, Viewport, Right Pane and Feedback Line.
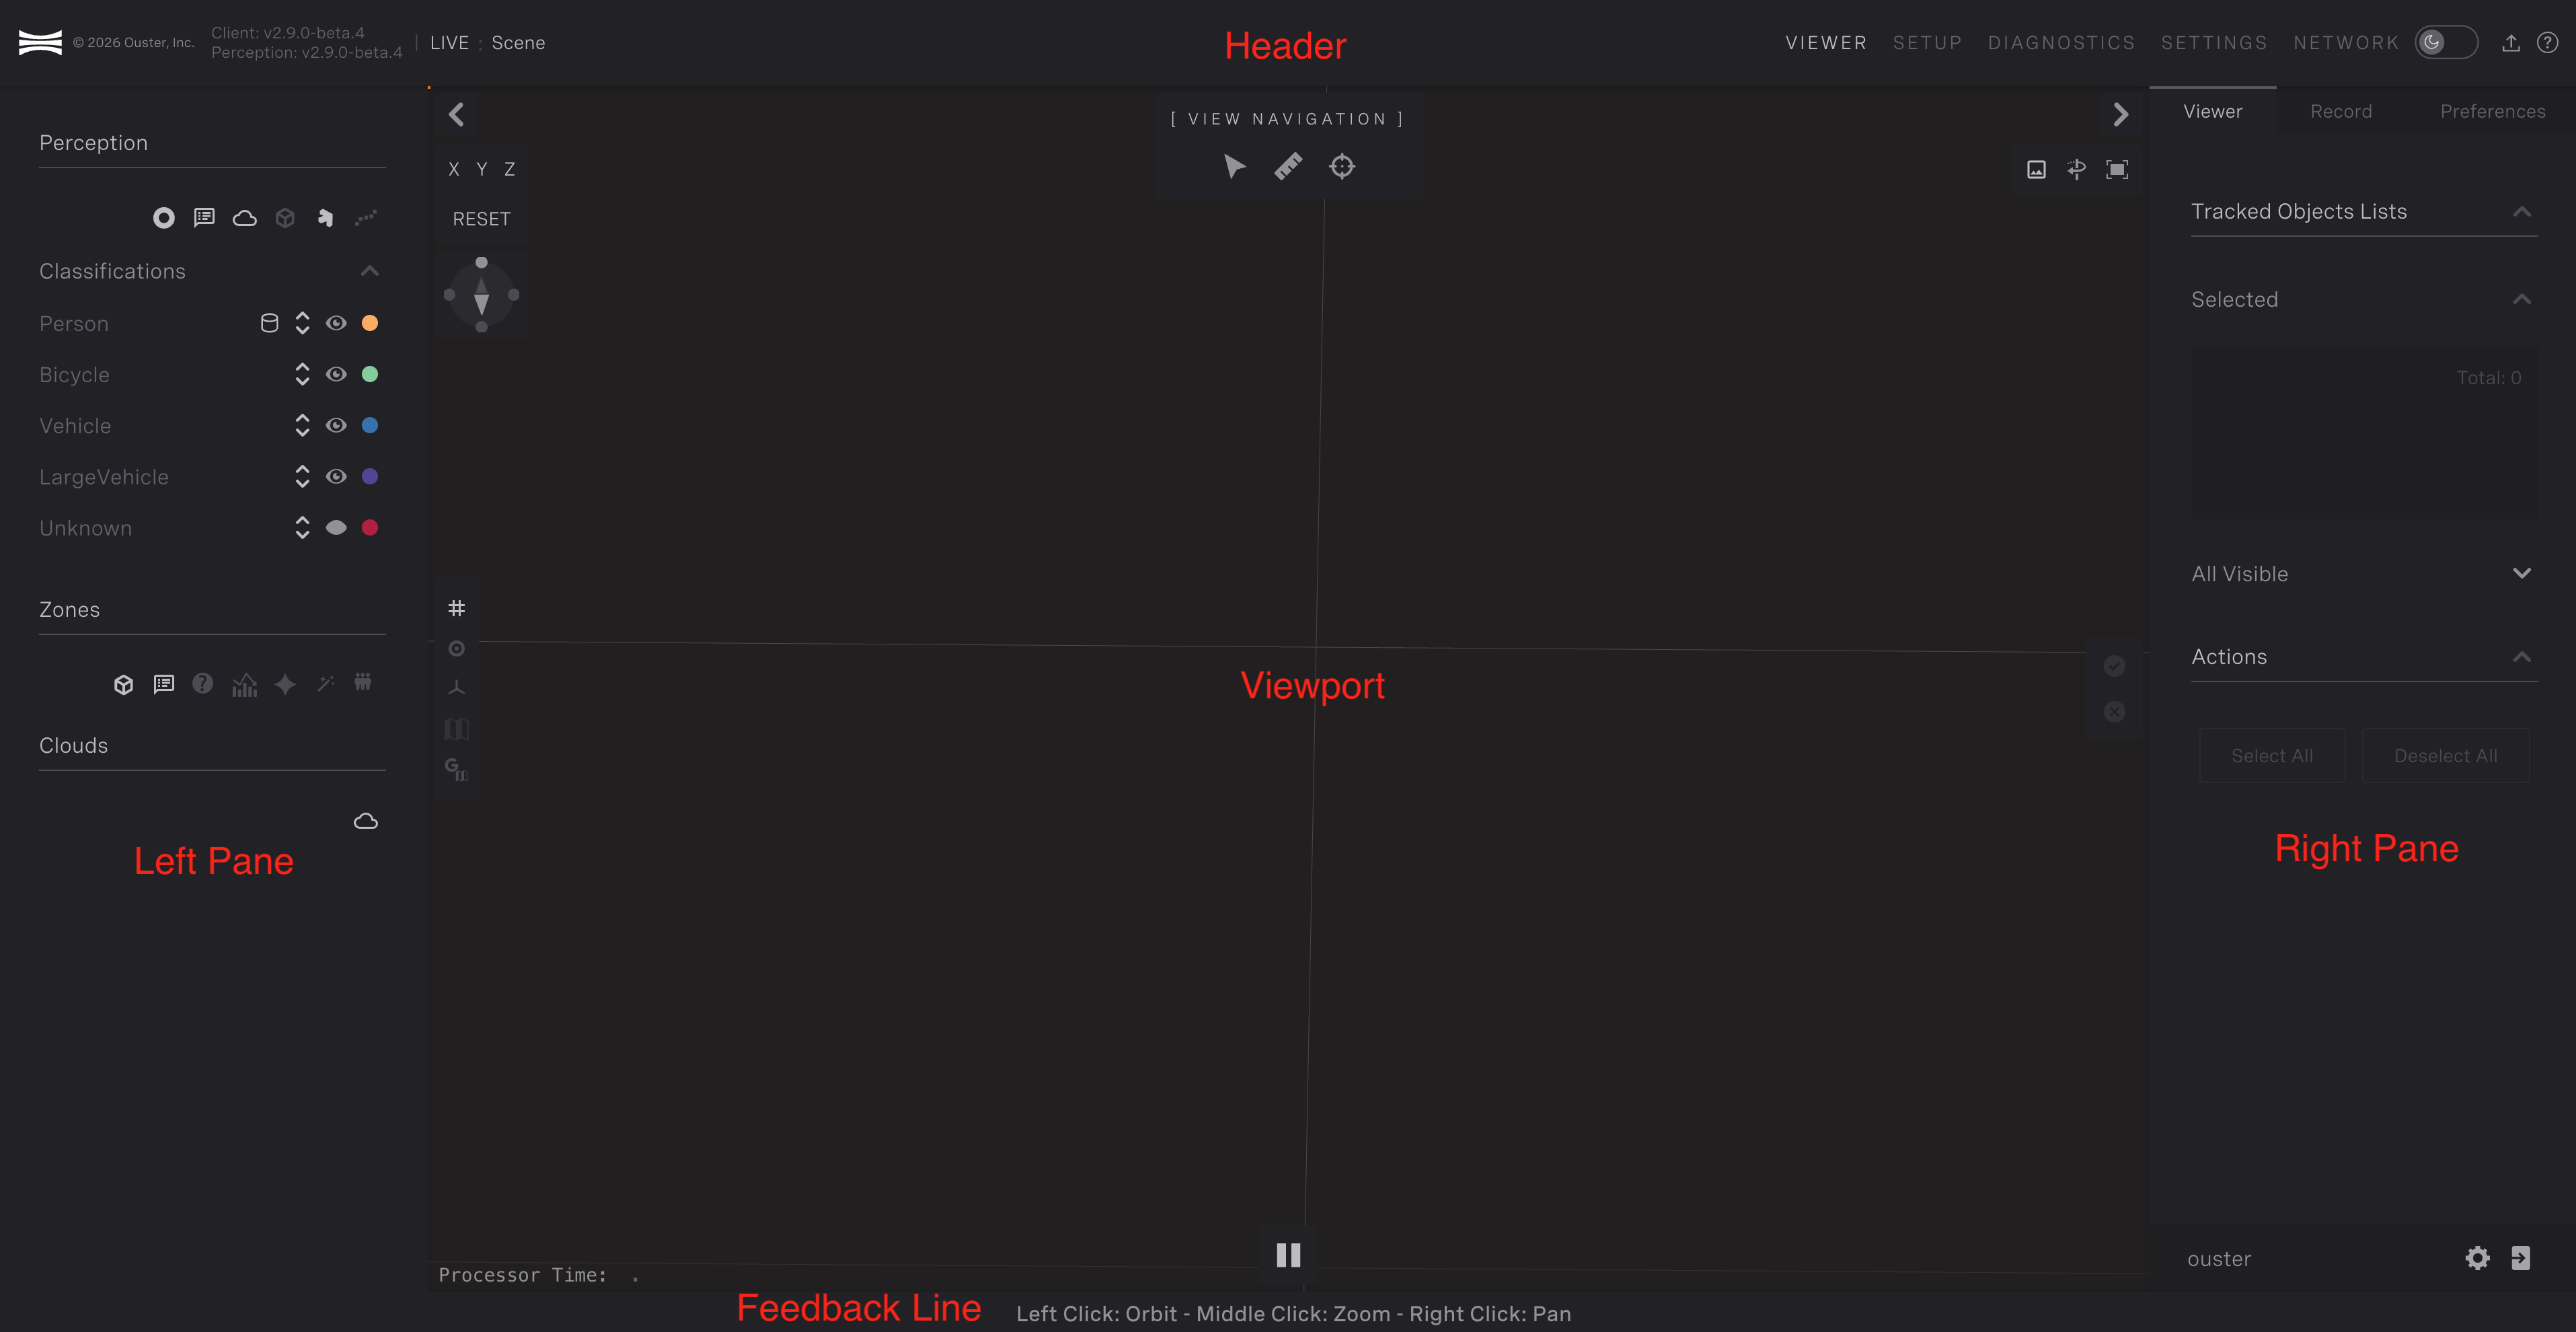
Ouster Gemini Detect Layout
Header
The header contains application information, the local scene name and the navigation menu.
The
Application Informationnext to the logo displays the running front and backend version. The user can copy to their systems pasteboard the version by clicking on the relative linksThe
Scene Nameis a user defined identifier for the viewing setup, its value would be reflected on the browser’s tab name and is exposed under preferences.The
Navigation Menuallow the user to navigate to a desired sections such as:Viewer: Main viewing section of the perception output.
Overview: Section that provides the user with tools and info to position the sensors and create/define zones.
Diagnostics: Section with information for the status of the edge computer and the sensors attached.
Settings: Section exposing all modifiable parameters for the system.
Network Configuration: Section to view and edit network preferences
Light and Dark Mode toggle: Toggle between light and dark modes of displaySoftware Update: Allows to upload tarball image to update softwareDocumentation: Section with links to Detect Documentation, Detect Release Notes, Customer Support Portal and End User License Agreement
Left Pane
In Viewer section: This displays options for the system’s key structures - Perception, Zones and Clouds.
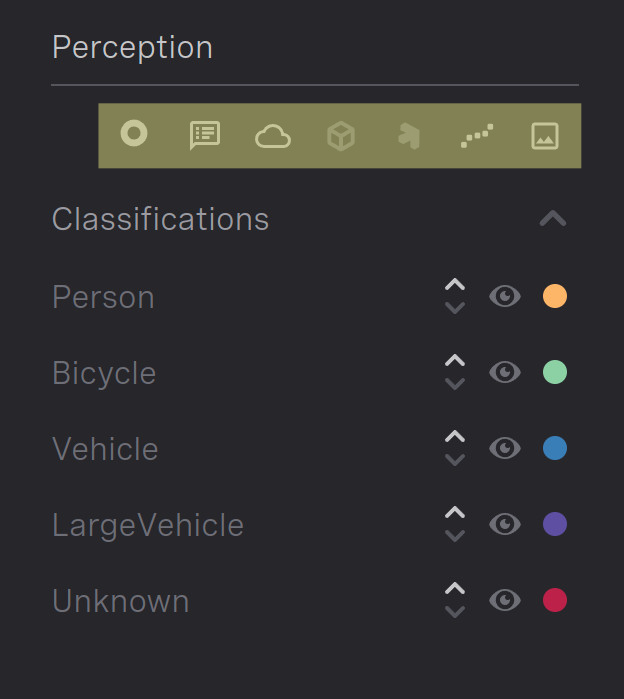
Perception: Hosts an array of icons to control the display of different perception elements and a list of the available classes with options to control their visibility, point size and color.
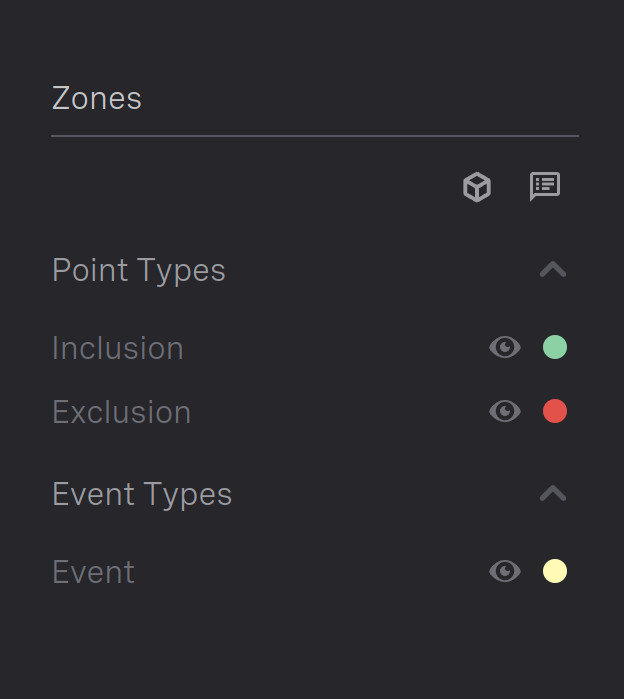
Zones: Lists the available types with options to control their visibility and color.
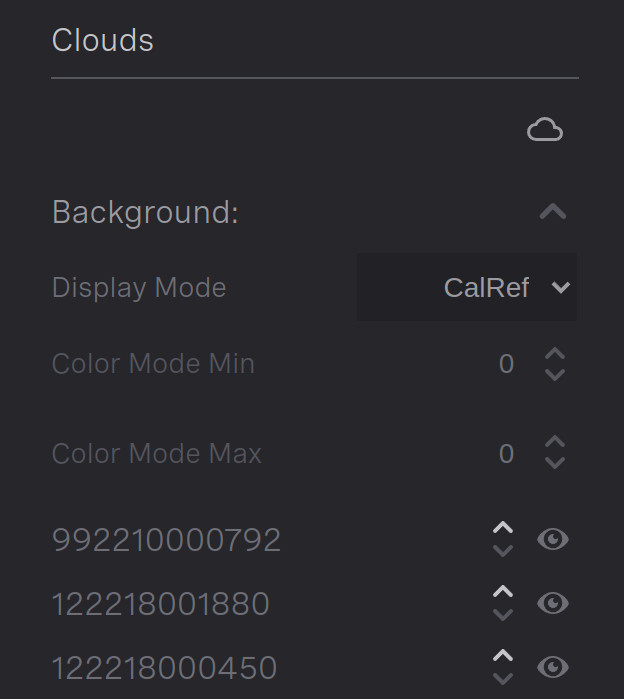
Clouds: Lists the active sensors with options their visibility, point size and color.
In Setup section: It will display options for Source Management, License Activation and License Information.
Source Management: Allows the user to select sensors discovered by the system or sensors already added. These can the be added, removed or configured. There is also an option to add a sensor manually by hostname.
License Activation(New License): Allows the user to add a new license by entitlement ID, or start the offline licensing process. The offline licensing button should be used in the case where a system cannot be connected to the internet. It brings up a form with a locking code, which when provided to Ouster can be used to obtain a device specific locking key.
License Information: Displays the current licenses available on the system along with the number activated, remaining and expiry date. There is a section for each license.

Viewer Section |

Setup Section |
Right Pane - Viewer
In Viewer section there are three tabs
Tracked: Displays lists and actions to highlight extra information in the viewport. Two list are available, the currently selected set and the available objects present in the scene and toggle buttons to assist selecting/deselecting tracked objects.Record: Hosts lists and actions for recording the raw point clouds from the sensors.Preferences: User preferences options.

Tracked Objects |

Record |

Preferences |
Right Pane - Setup
In Setup section: It will host list and options for the sensor and zones
Sensor Management: Lists connected sensors and actions to store/align them.Zones: Lists created zones and options to modify their properties.

Sensor Management |

Zones |
Feedback Line
The feedback line provides information to the user when interacting with the scene.

Feedback
Viewport
The 3D world with an overlay of tools and options the user can interact with.
Top Left Cornerhas an array of buttons to switch to a predefined direction.Top Middlehas a panel that indicate the selected tool and the available tools for the section.Top Right Cornerhas buttons to hide/display 2D image, Auto-rotate Point cloud and enable full-screen.Middle Right SideSelect or deselect all tracked objects.Bottom Middleplayback controls.Lower Left Cornerdisplays the current local time.Middle Left Sidetoggle buttons controlling the ground grid, range rings, world axis display on the point cloud and underlay maps.
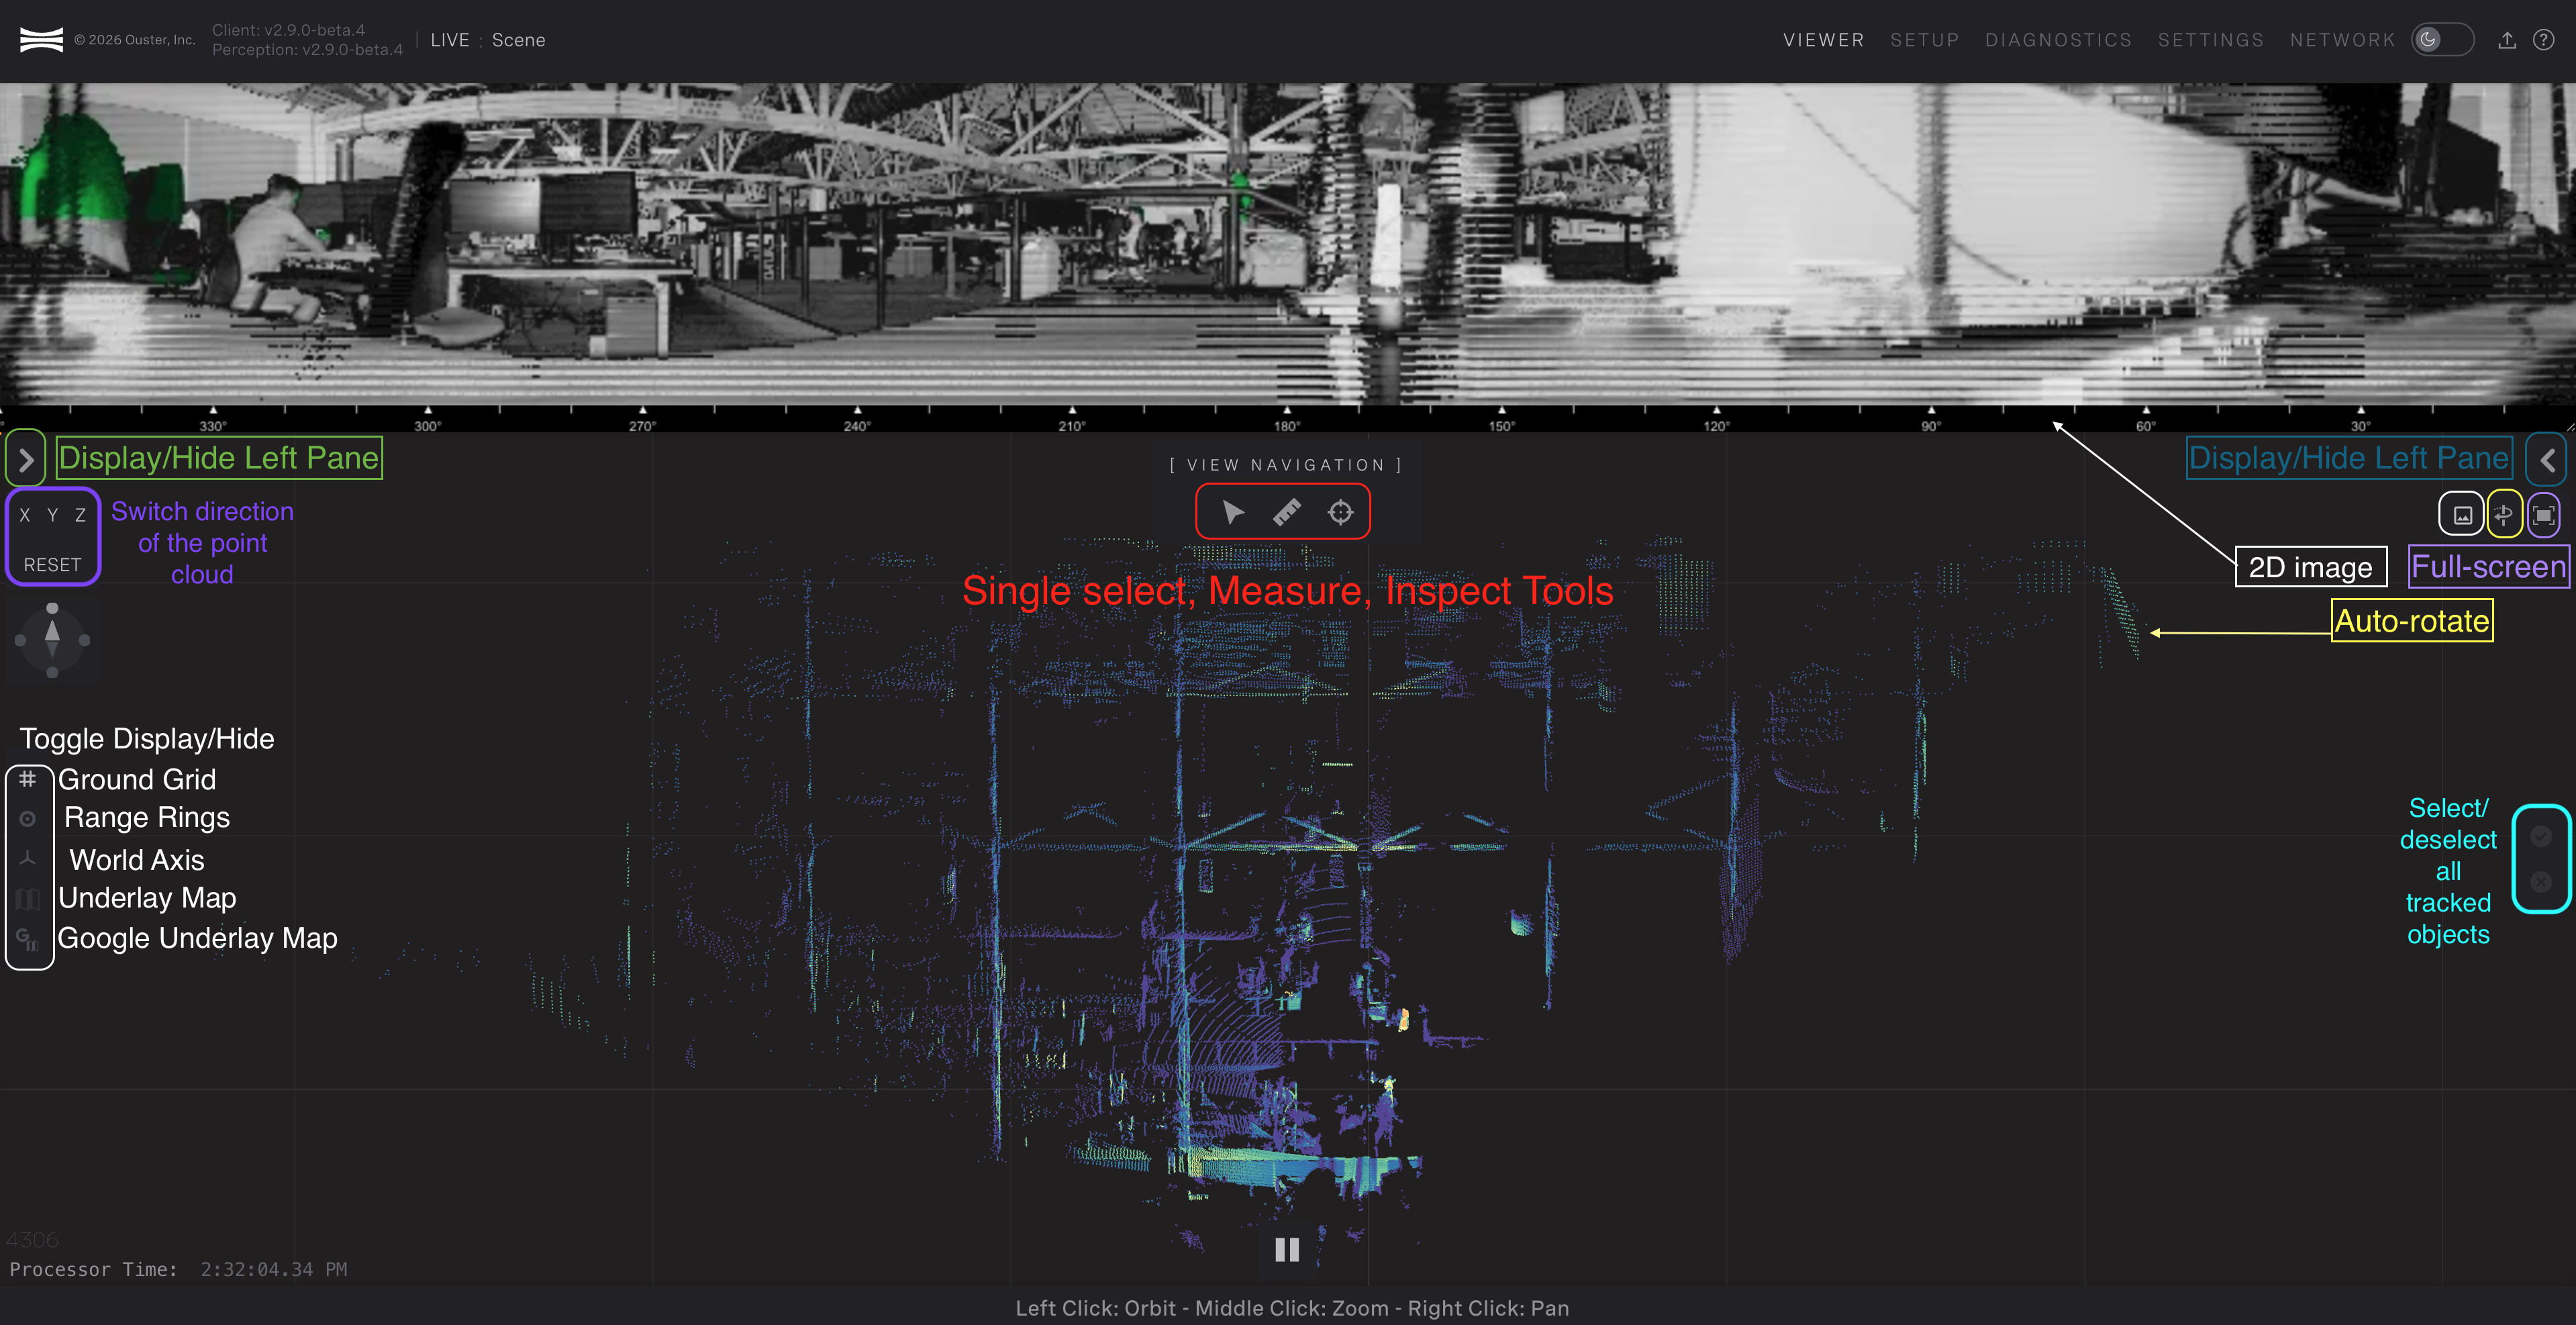
Viewport
Viewer
The Viewer is the section that the user can view the scene and select the output of the perception server.
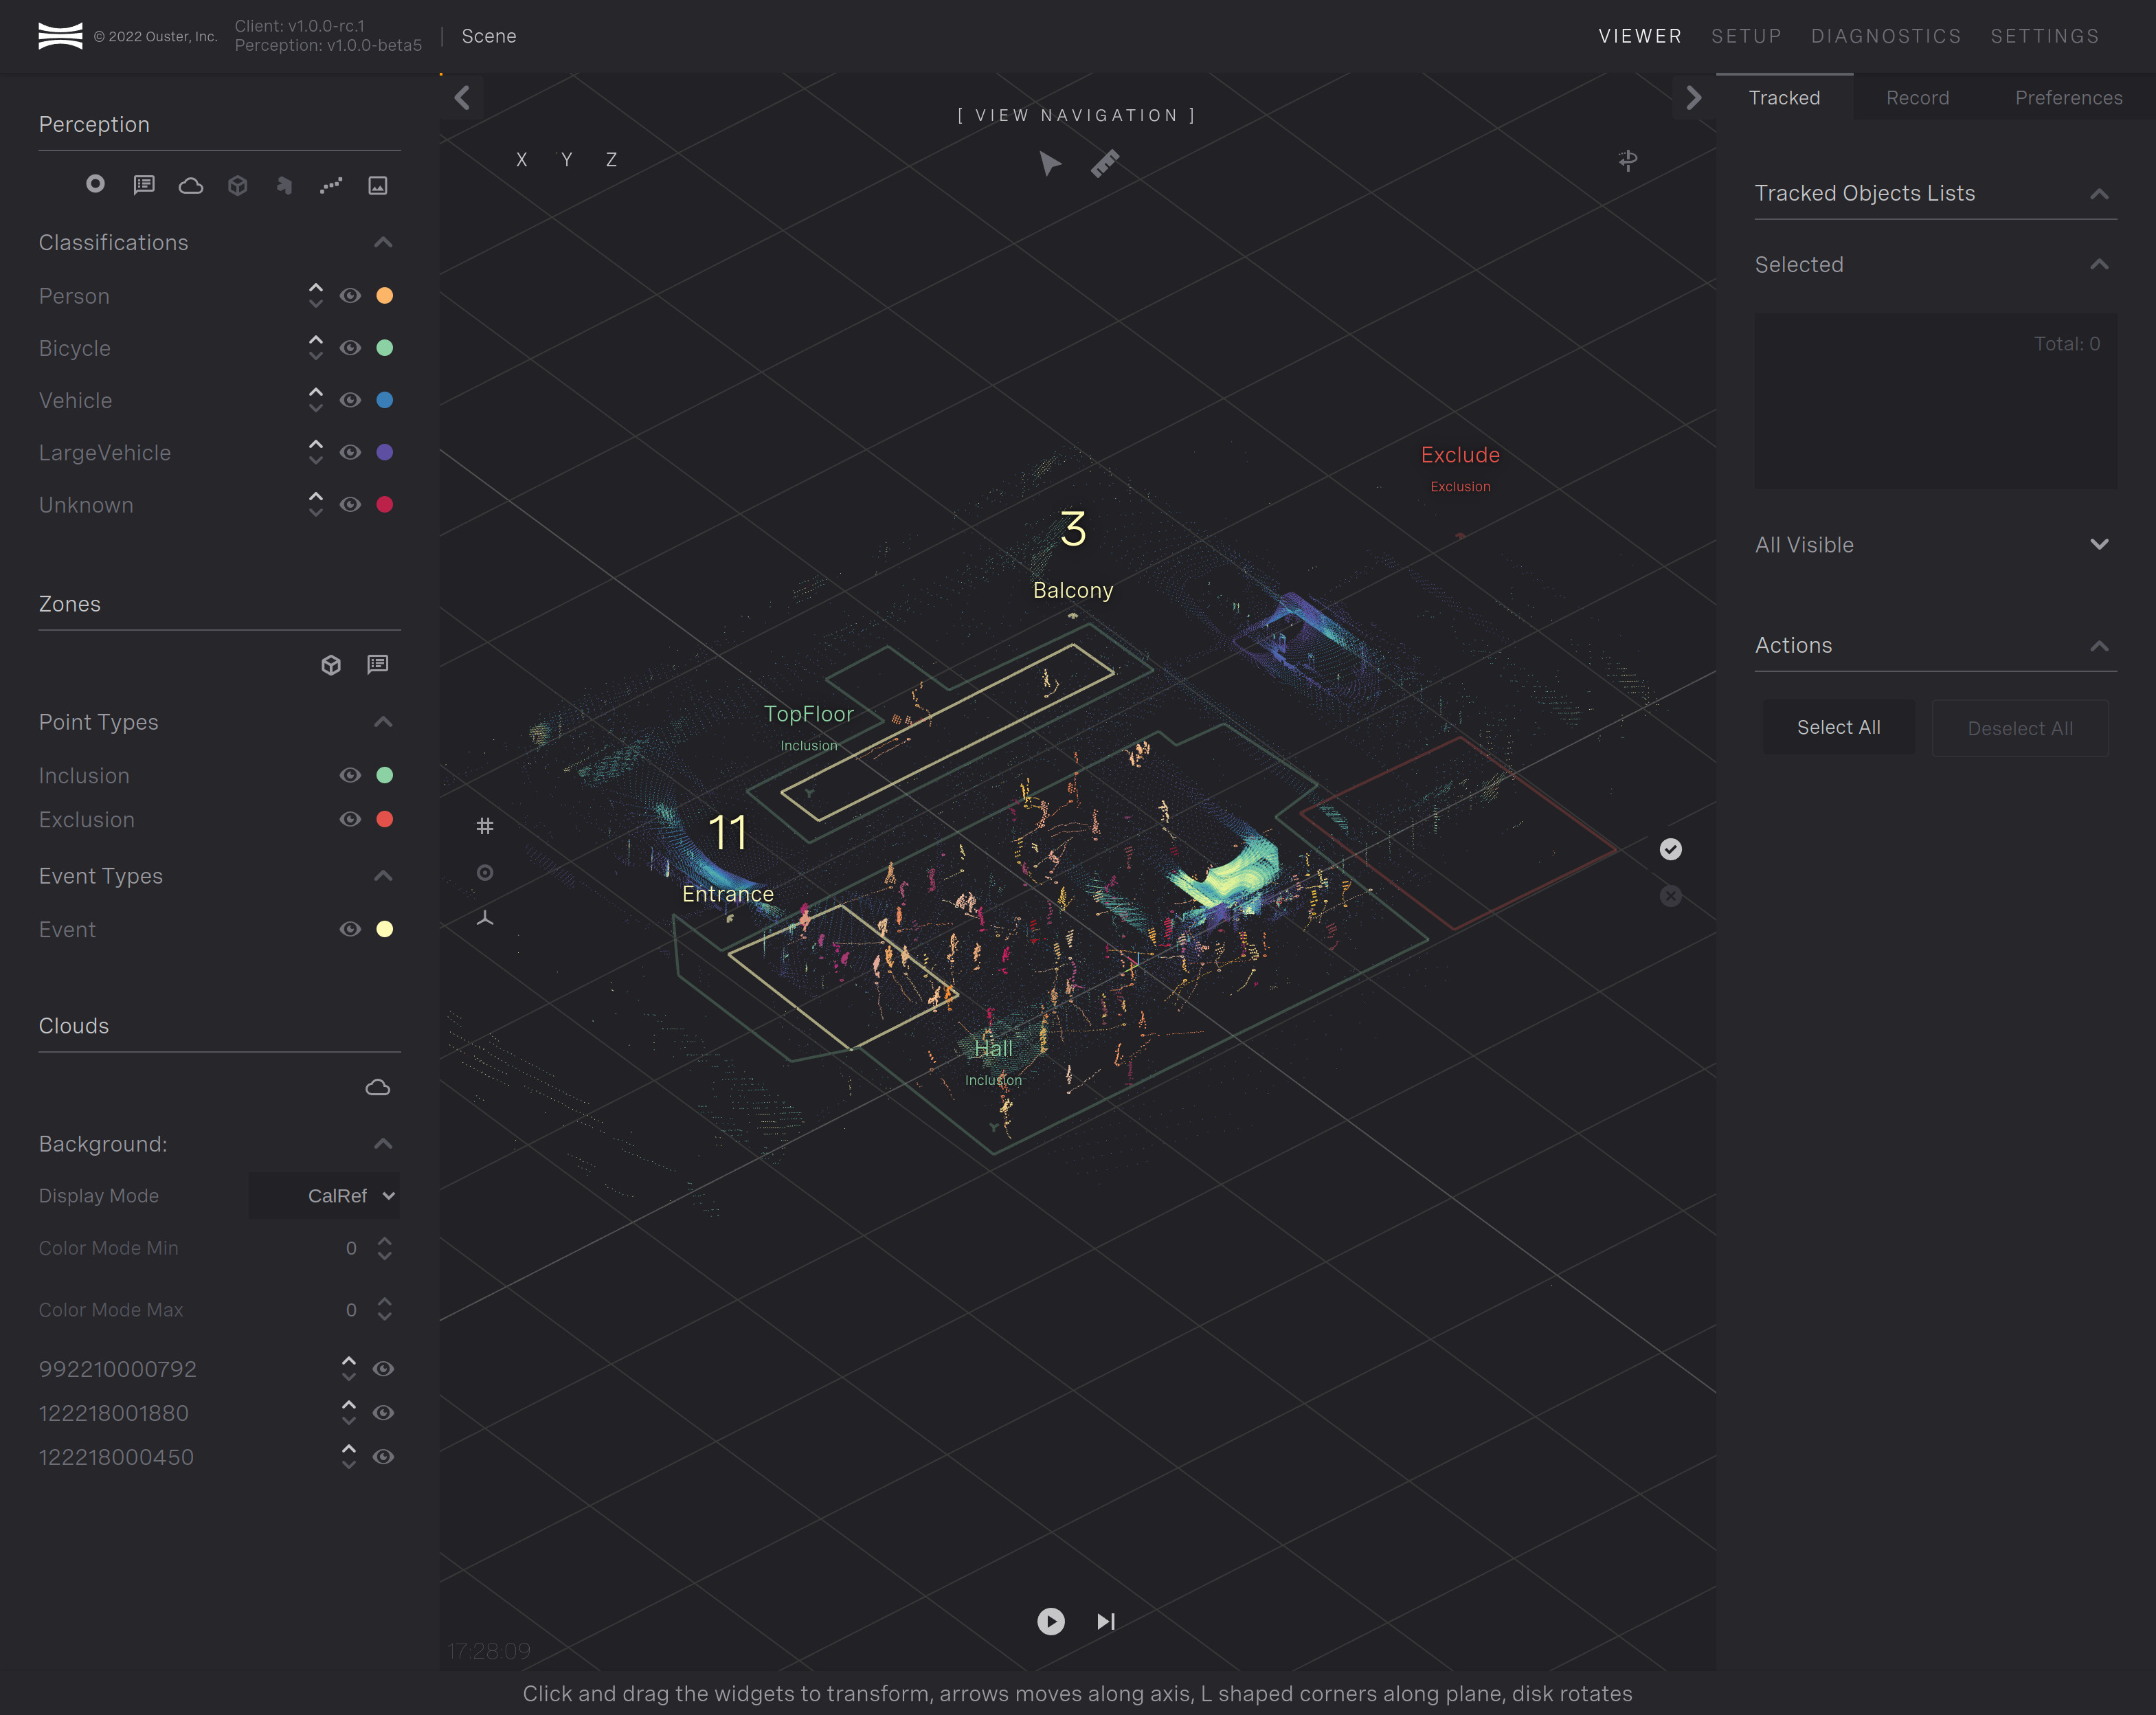
Viewer section
Short Cut Keys:
fframes your selection
qselect tool
Lshows pitch and roll transform widgets
-+changes transform size
space-barwill start stop playback
Copy/Paste/EscPlayback Short keys:
Arrow keysandPageup/down
Tools
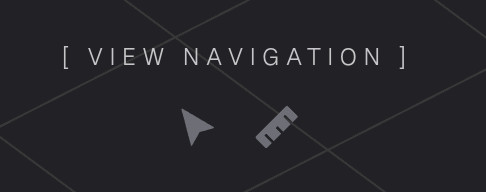
Select
Used to select one or more objects being tracked, and when selected, their info bubble is displayed and listed under Tracked Objects List on the right.
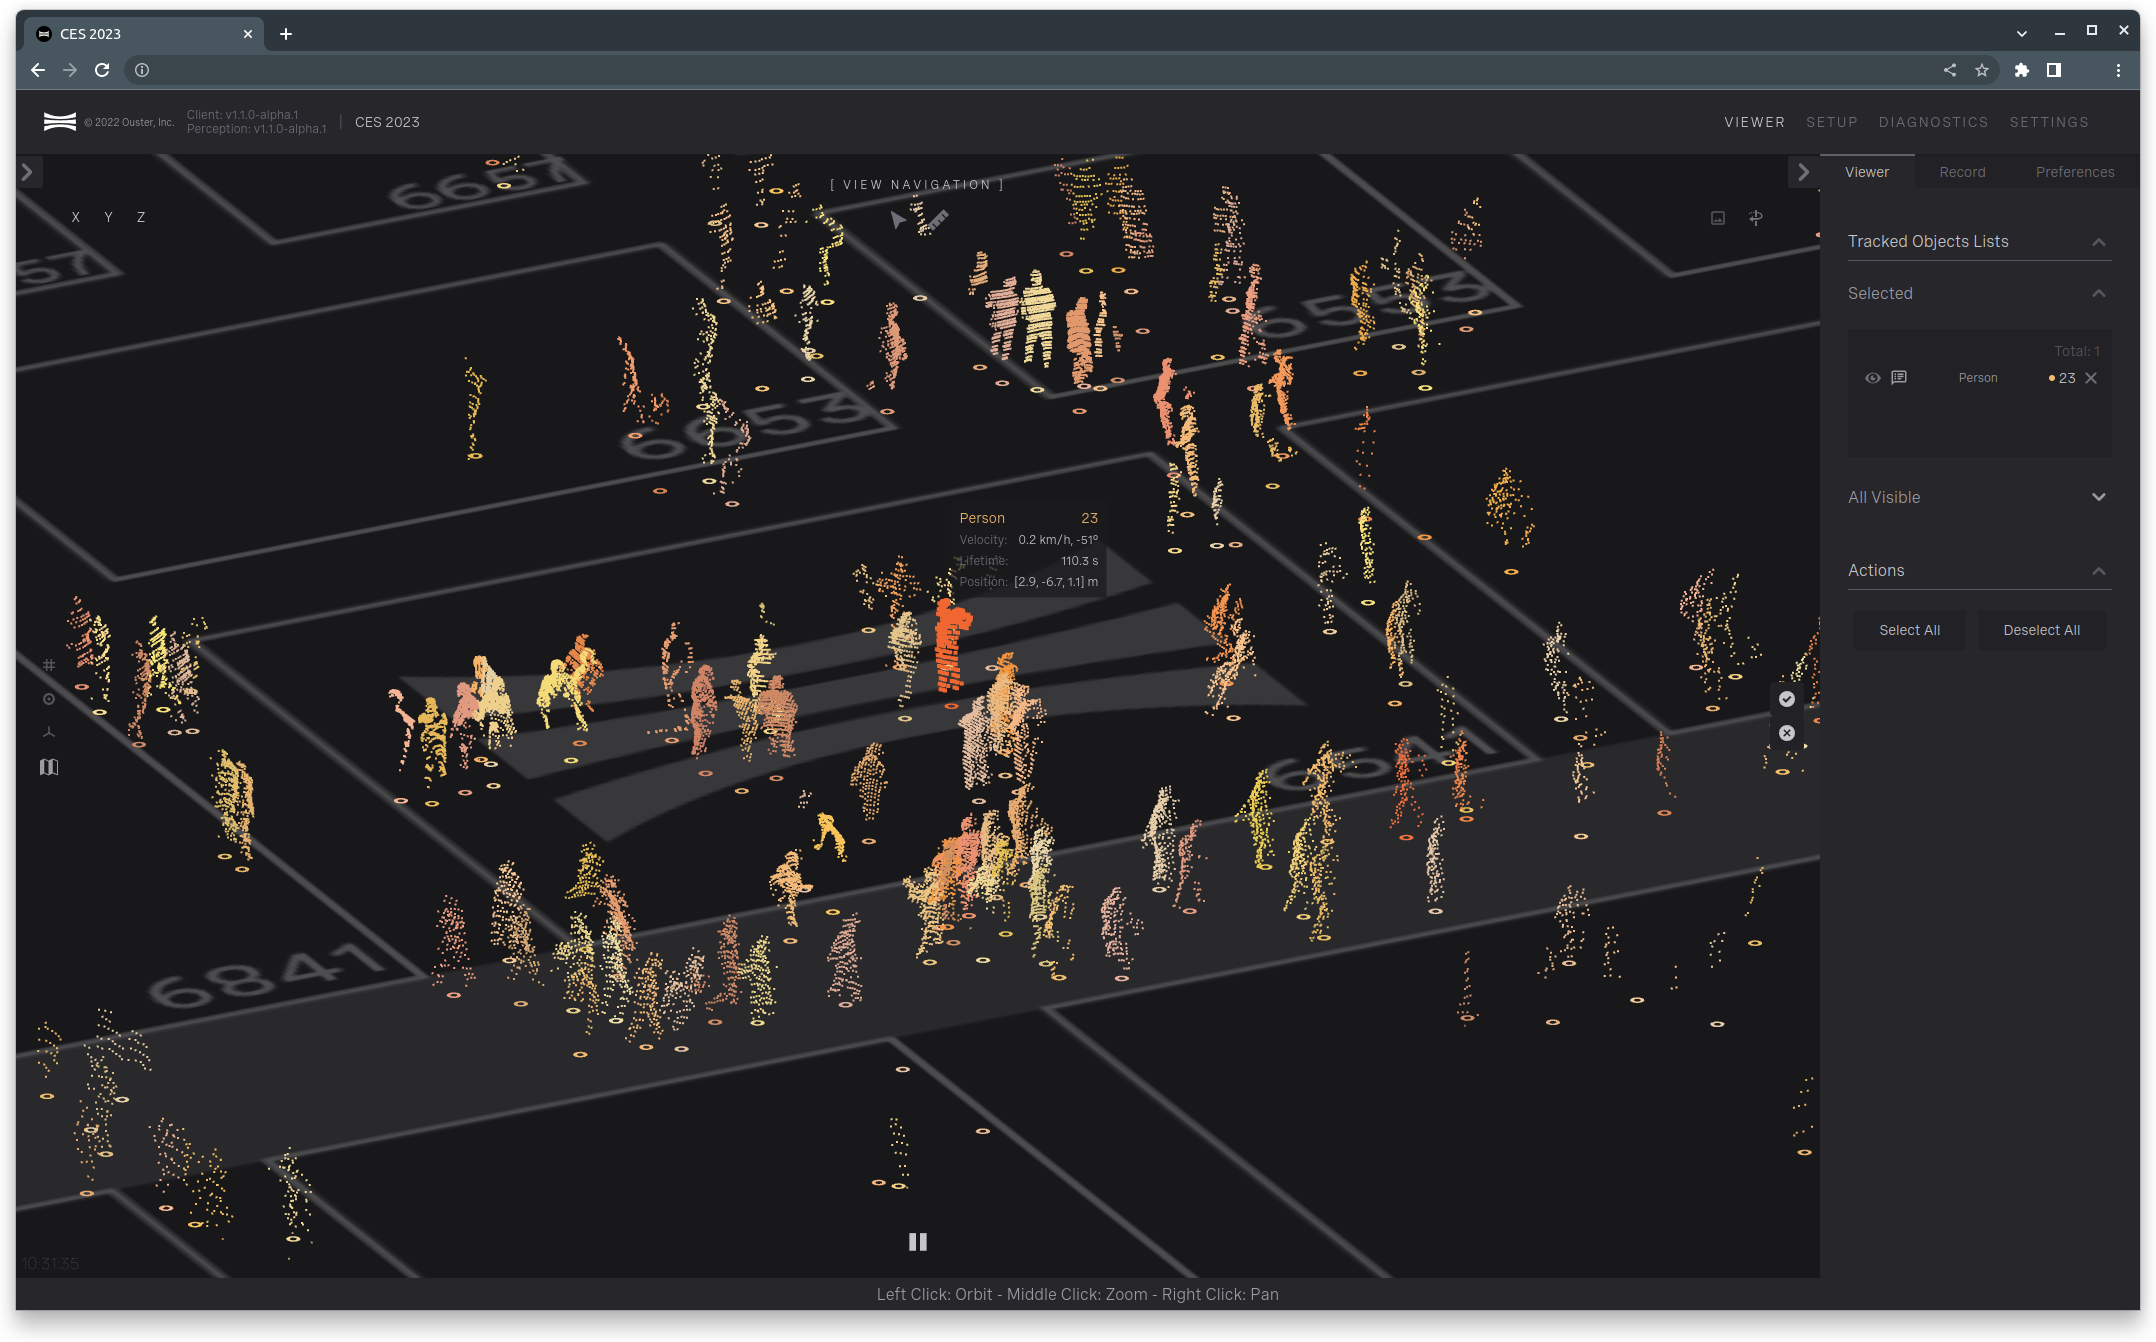
Viewer Select
Measure
The measure tool allows to measure distances and display the coordinates of the ground point under the mouse cursor.
Tools option
Left Pane
Dedicated areas for the system’s key structures - Perception, Zones and Clouds.Please refer to Left Pane.
Perception, Zones and Clouds
Perception Controls |
Zones |
Clouds |
Perception: Descriptions of the icons, from left to right:
Ring icon- toggles the visibility of the tracked object’s location.Bubble icon- toggles the visibility of the tracked object’s informational labels.Cloud icon- toggles the visibility of the tracked object’s point clouds.Cube icon- toggles the visibility of the tracked object’s bounding boxes.Trident icon- toggles the visibility of the tracked object’s top corners.Dotted line icon- toggles the visibility of the tracked object’s trajectory.Image icon- toggles the visibility of the sensors near IR.
Zones: Lists the available types with options to control their visibility and color.
Clouds: Lists the active sensors background point clouds with options to control their visibility, point size, color and colorization method.
Right Properties Pane
Displays lists and actions to provide additional information in the viewport. There are two lists: one for the currently selected set and one for available objects in the scene. Toggle buttons are provided to help select or deselect tracked objects.
For more information, please refer to Right Pane - Viewer.
Recording
The Recording tab of Ouster Gemini Detect provides the capability to capture raw point clouds or Event Recordings.
Raw clouds are stored in .pcap format and are accompanied by the system state at the time of recording. These recordings only contain the raw point cloud data streaming from the lidar. There is no perception or processing applied to the data.
Event recordings contain the output of the perception algorithms running on the device. These recordings will reflect the chosen perception settings at the time of recording. Recordings are automatically in sync with the Gemini Portal and cannot be downloaded or deleted manually. This tab can be navigated to by clicking Viewer, then Record.
Creating an Event Recording
To create an event recording, click the red icon next to Start Event Recording. This will begin the recording of perception data from the sensors. To stop the recording, click the Stop Event Recording button that is present when a recording is currently ongoing.
Recording a PCAP
To record a .pcap, click the red icon next to Start .pcap Recording. This will begin the recording of the raw point cloud from all sensors. To stop the recording, click the Stop .pcap Recording button that is present when a recording is currently ongoing. The recorded file will be listed in the .pcap Recordings list.
The prefix for the recorded filename can be set within the Recording Default Prefix textbox. The resulting file format is the defined prefix, the date of recording, and the time the recording commenced. If no prefix is supplied, the filename will be just be the date and recording time.
An example of the resulting recorded data is shown in the image below.
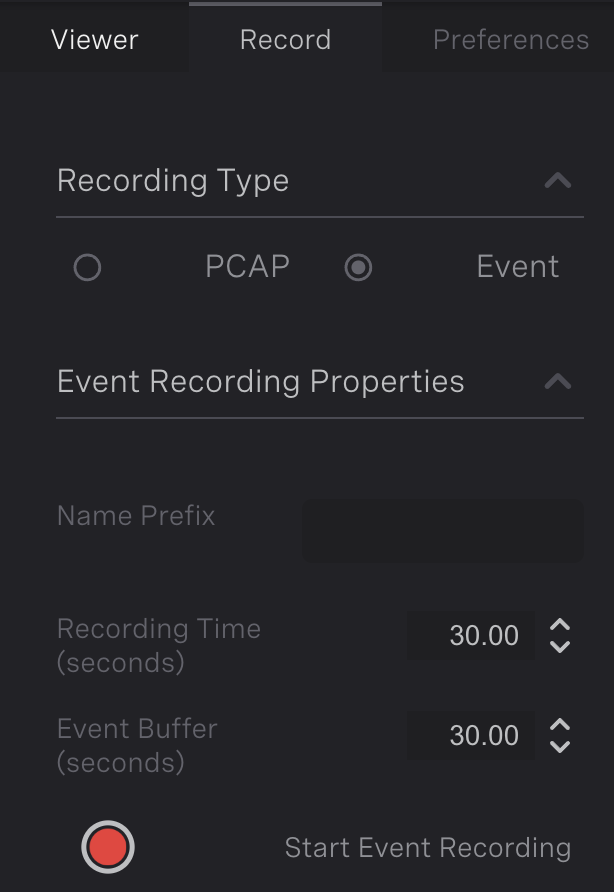
Event Recording Pane |
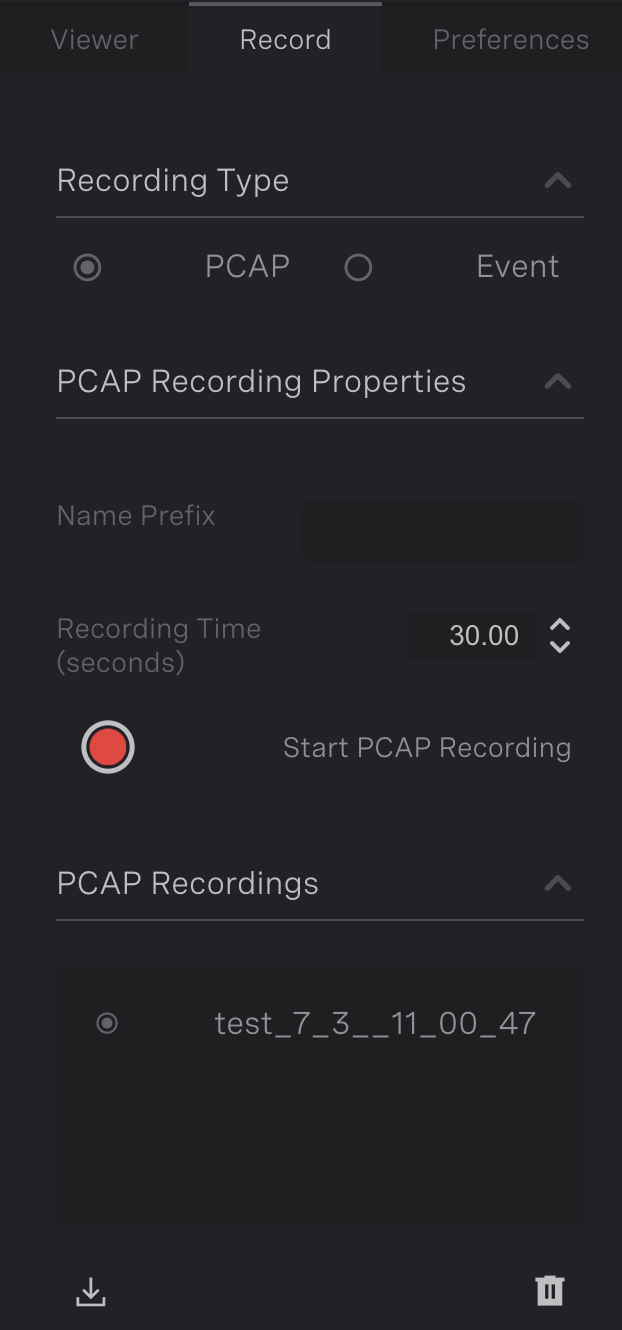
PCAP Recording Pane |
Downloading .pcap Recording
Once the data has been recorded, the data can be downloaded by selecting the recording in the list and clicking the Download icon. Two types of files will be downloaded
.pcapfile, storing the point cloud streamed data directly from the sensors..tarfile, representing Ouster Gemini Detect’s settings at the time of recording and the sensor metadata for each connected sensor.
Deleting .pcap Recording
To delete a recording from disk, select a recording to discard in the recording list, then click the Delete icon. The recording will not be recoverable afterwards.
Preferences
The Ouster Gemini Detect web GUI provides a number of preferences for the user to customize their viewing experience. These preferences are stored in the user’s browser. The preferences are accessible from the main Viewer tab of the GUI. On the right side of the screen, below the main application tabs, there are several sub-tabs. Clicking on the Preferences sub-tab will open the preferences panel.
Note
This setting is local to each client and will not be reflected on other browsers connected to the backend.
Scene: This section allows the user to supply a name for the scene, such as
Parking Lot 1. This name will be displayed at the top of the GUI.Theme: This section allows the user to select from several pre-defined colour schemes for the GUI.
Range Rings: This section allows the user to configure the properties of range rings in the viewer.
Grid: This section allows the user to configure the properties of the square grid in the viewer.
Auto Rotate: Ouster Gemini Detect provides a mode to enable an automatic rotation of the scene in the viewer. This section allows the user to configure the speed of rotation.
Developer Mode: Enabling this mode exposes advanced functionality for developers.
The preferences panel is shown in the following image.
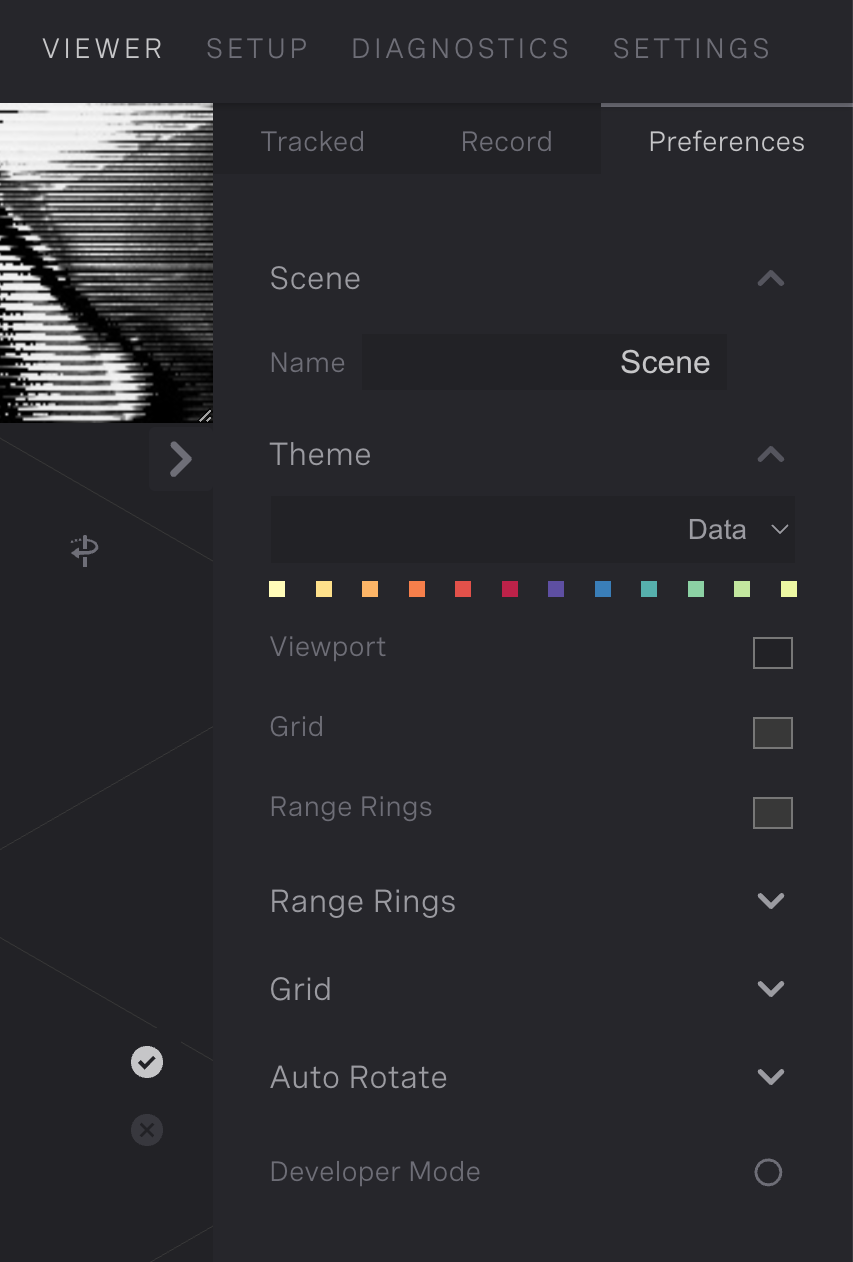
Preferences Panel
SETUP
Overview
The Setup section displays options for adding or removing sensors, New and remaining sensor licenses, aligning sensors, creating zones, areas of detection (AODs) and configuring underlay maps.
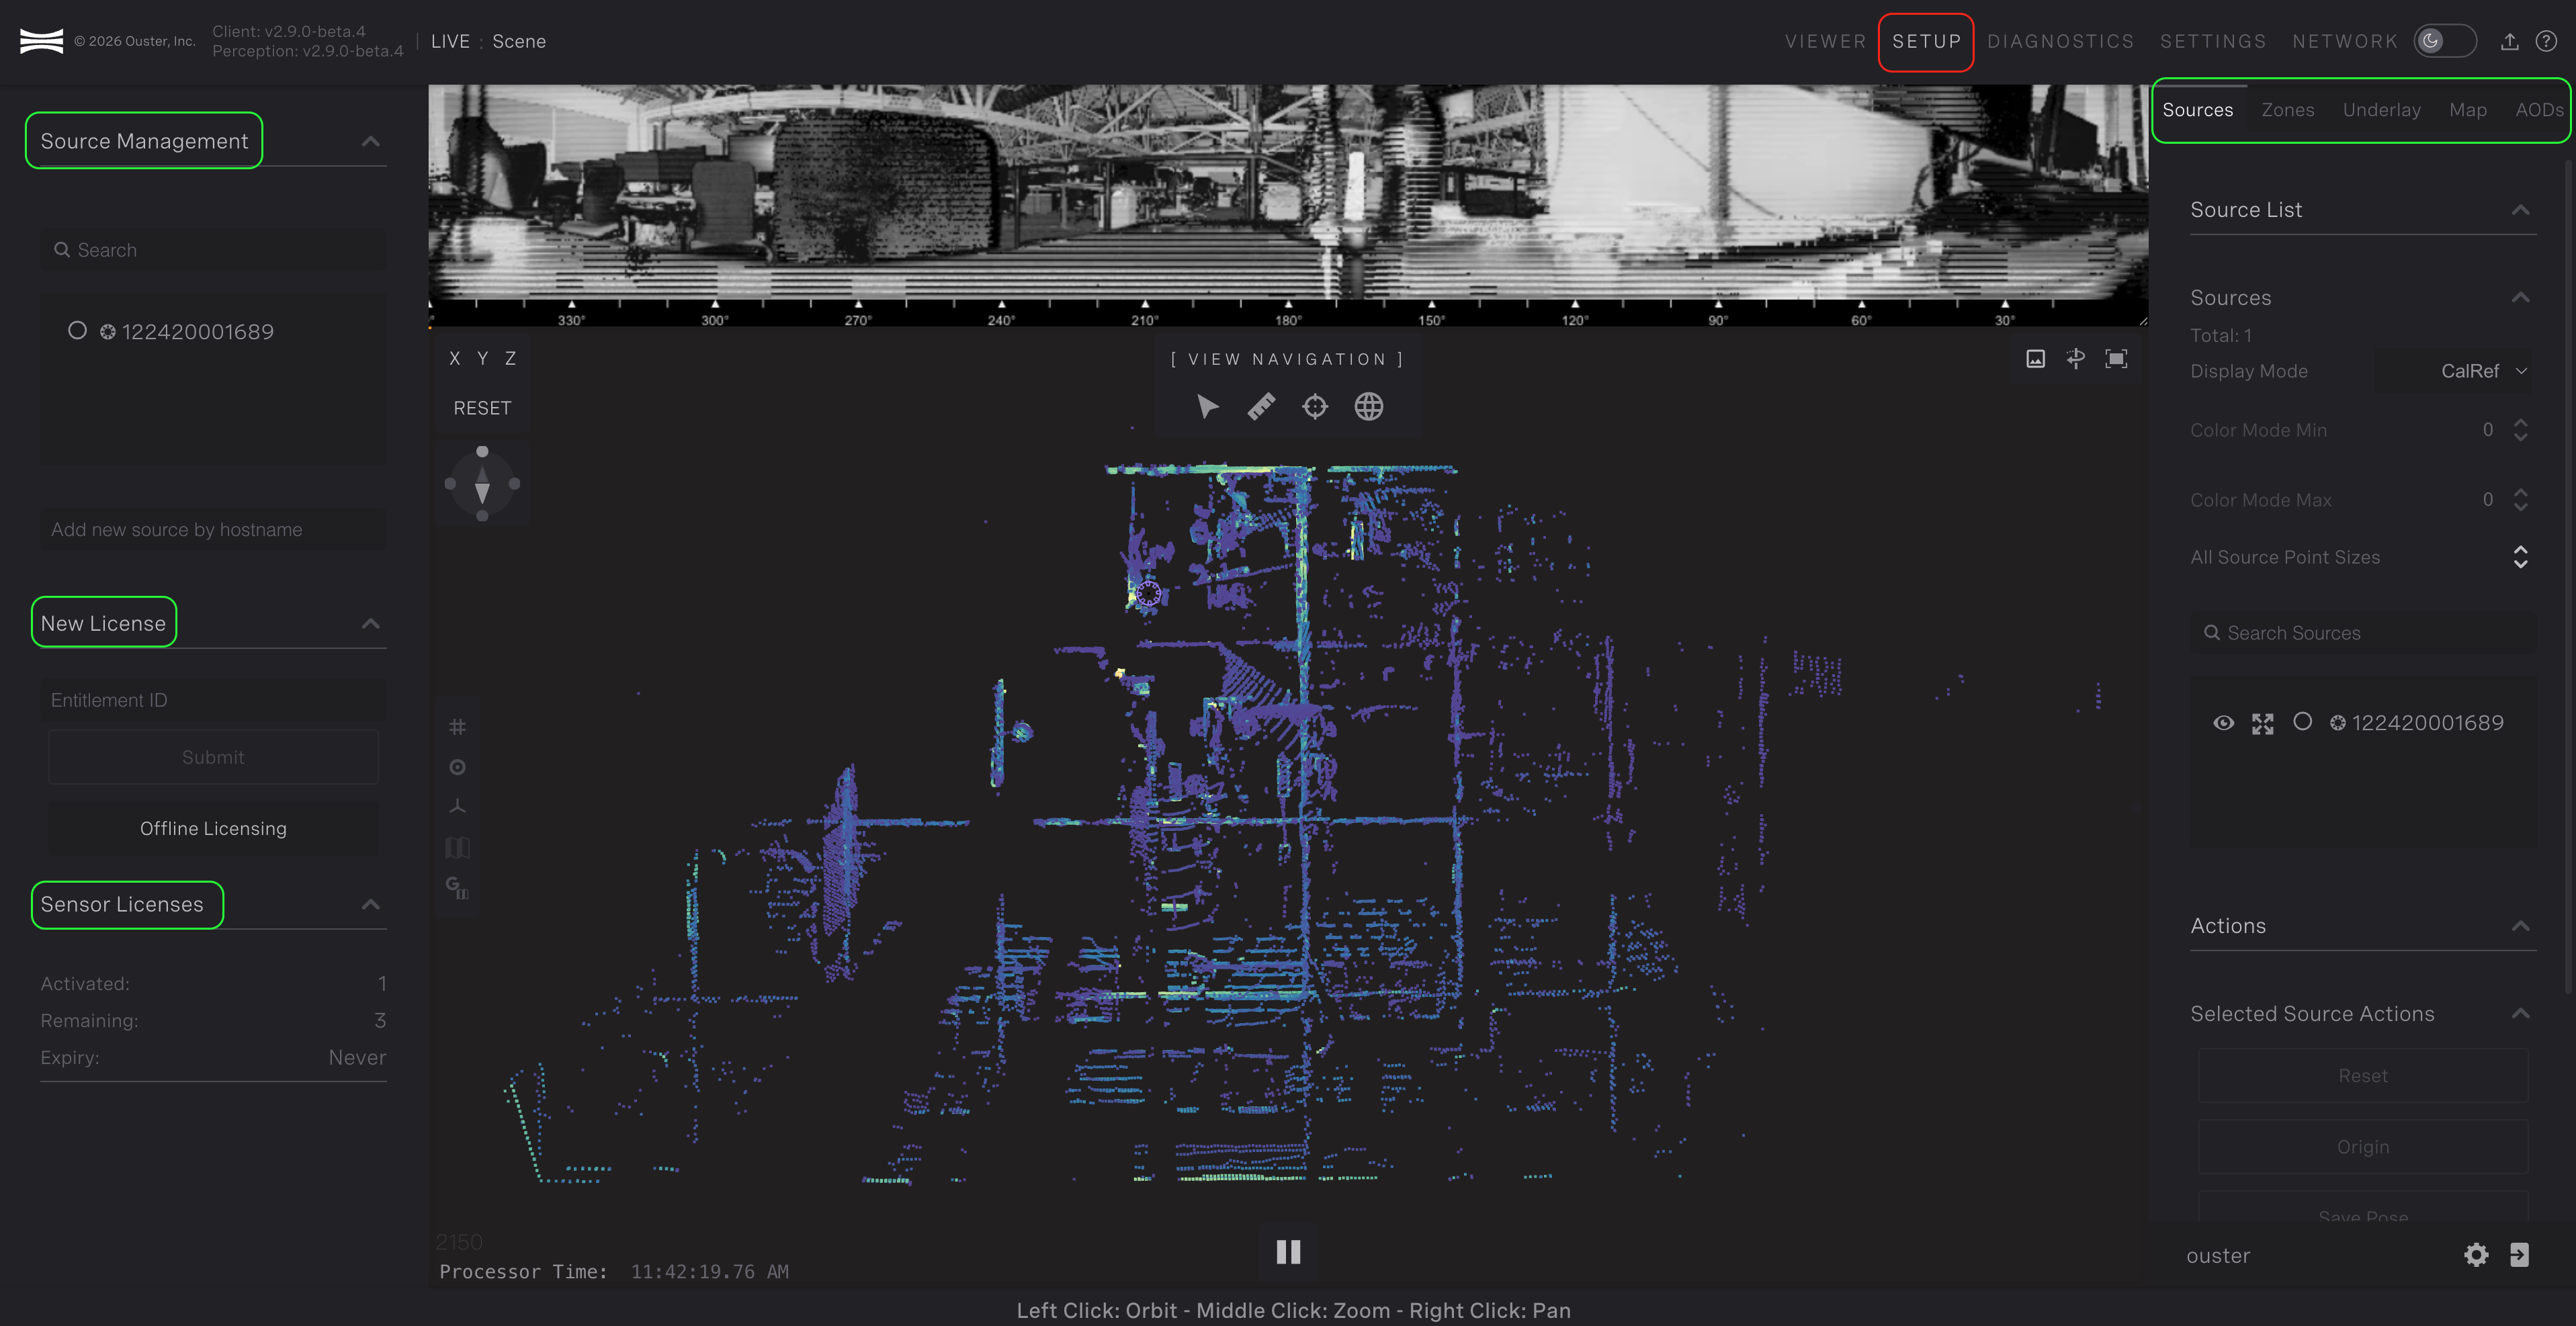
Setup Overview
Left Pane - Setup
Source Management
The Source Management allows the user to select sensors discovered by the system or sensors already added. These can the be added, removed or configured. There is also an option to add a sensor manually by hostname.
Adding Sensors
Check License: Ensure you have an active Activating the Software License with remaining capacity.
Locate Sensors: Available local sensors are automatically listed in the left panel.
Search and Filter: Find specific sensors by hostname using the search bar.
Connect: Select a sensor and click Add Sensor; connection typically takes 10 seconds.
Verify: Successful connection is indicated by bold text and the appearance of the point cloud.
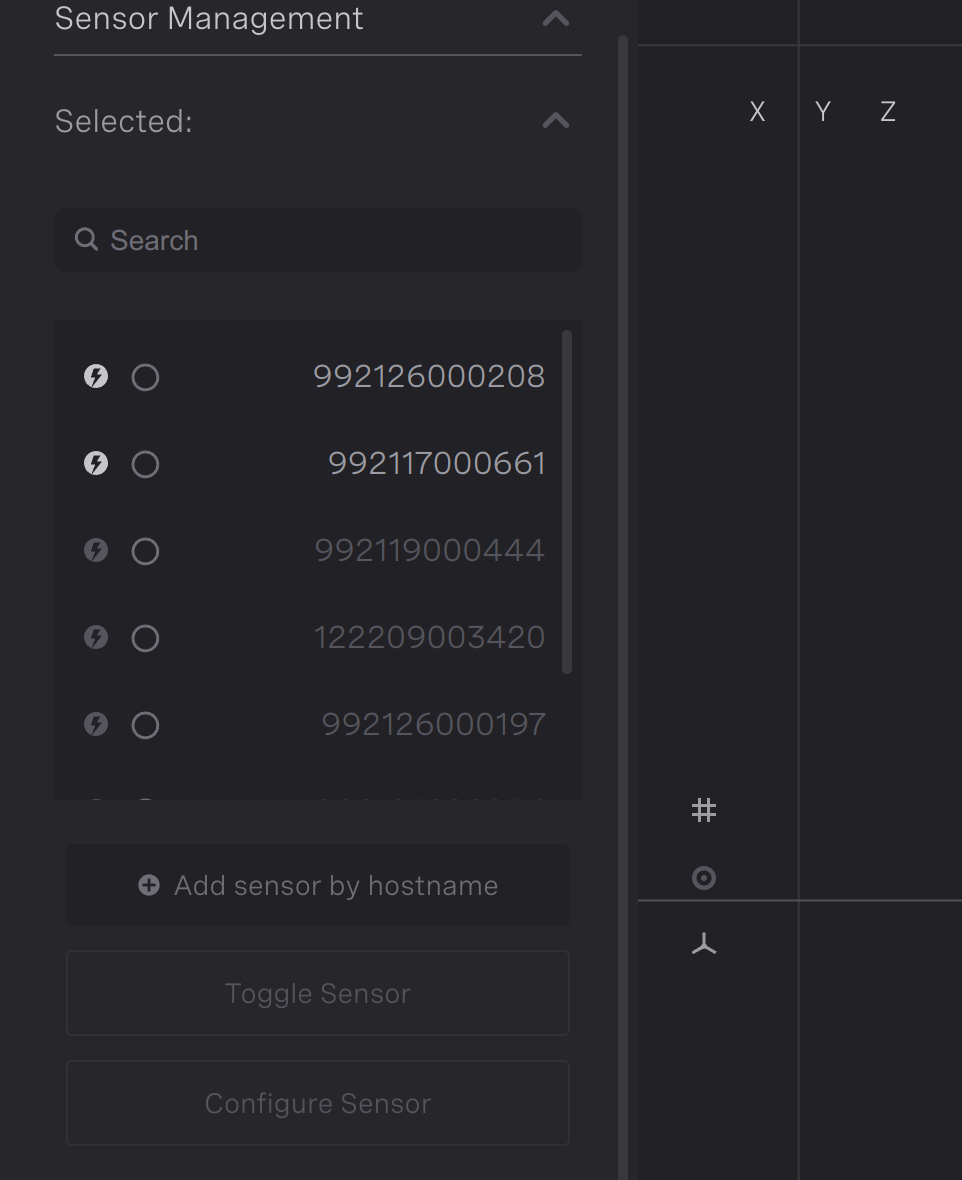
Adding Sensors Panel
Removing Sensors
To remove a sensor from Ouster Gemini Detect, select a bolded sensor hostname in the left panel, and then click Remove Sensor. The point cloud will no longer be visible in the view pane.
Configuring Sensors
To view the sensor’s configuration page, select the sensor in the left panel and click Configure Sensor. This will open the sensor’s dashboard, where it allows the user to update the firmware and edit the sensor’s configuration. Click the Documentation panel to see more information.
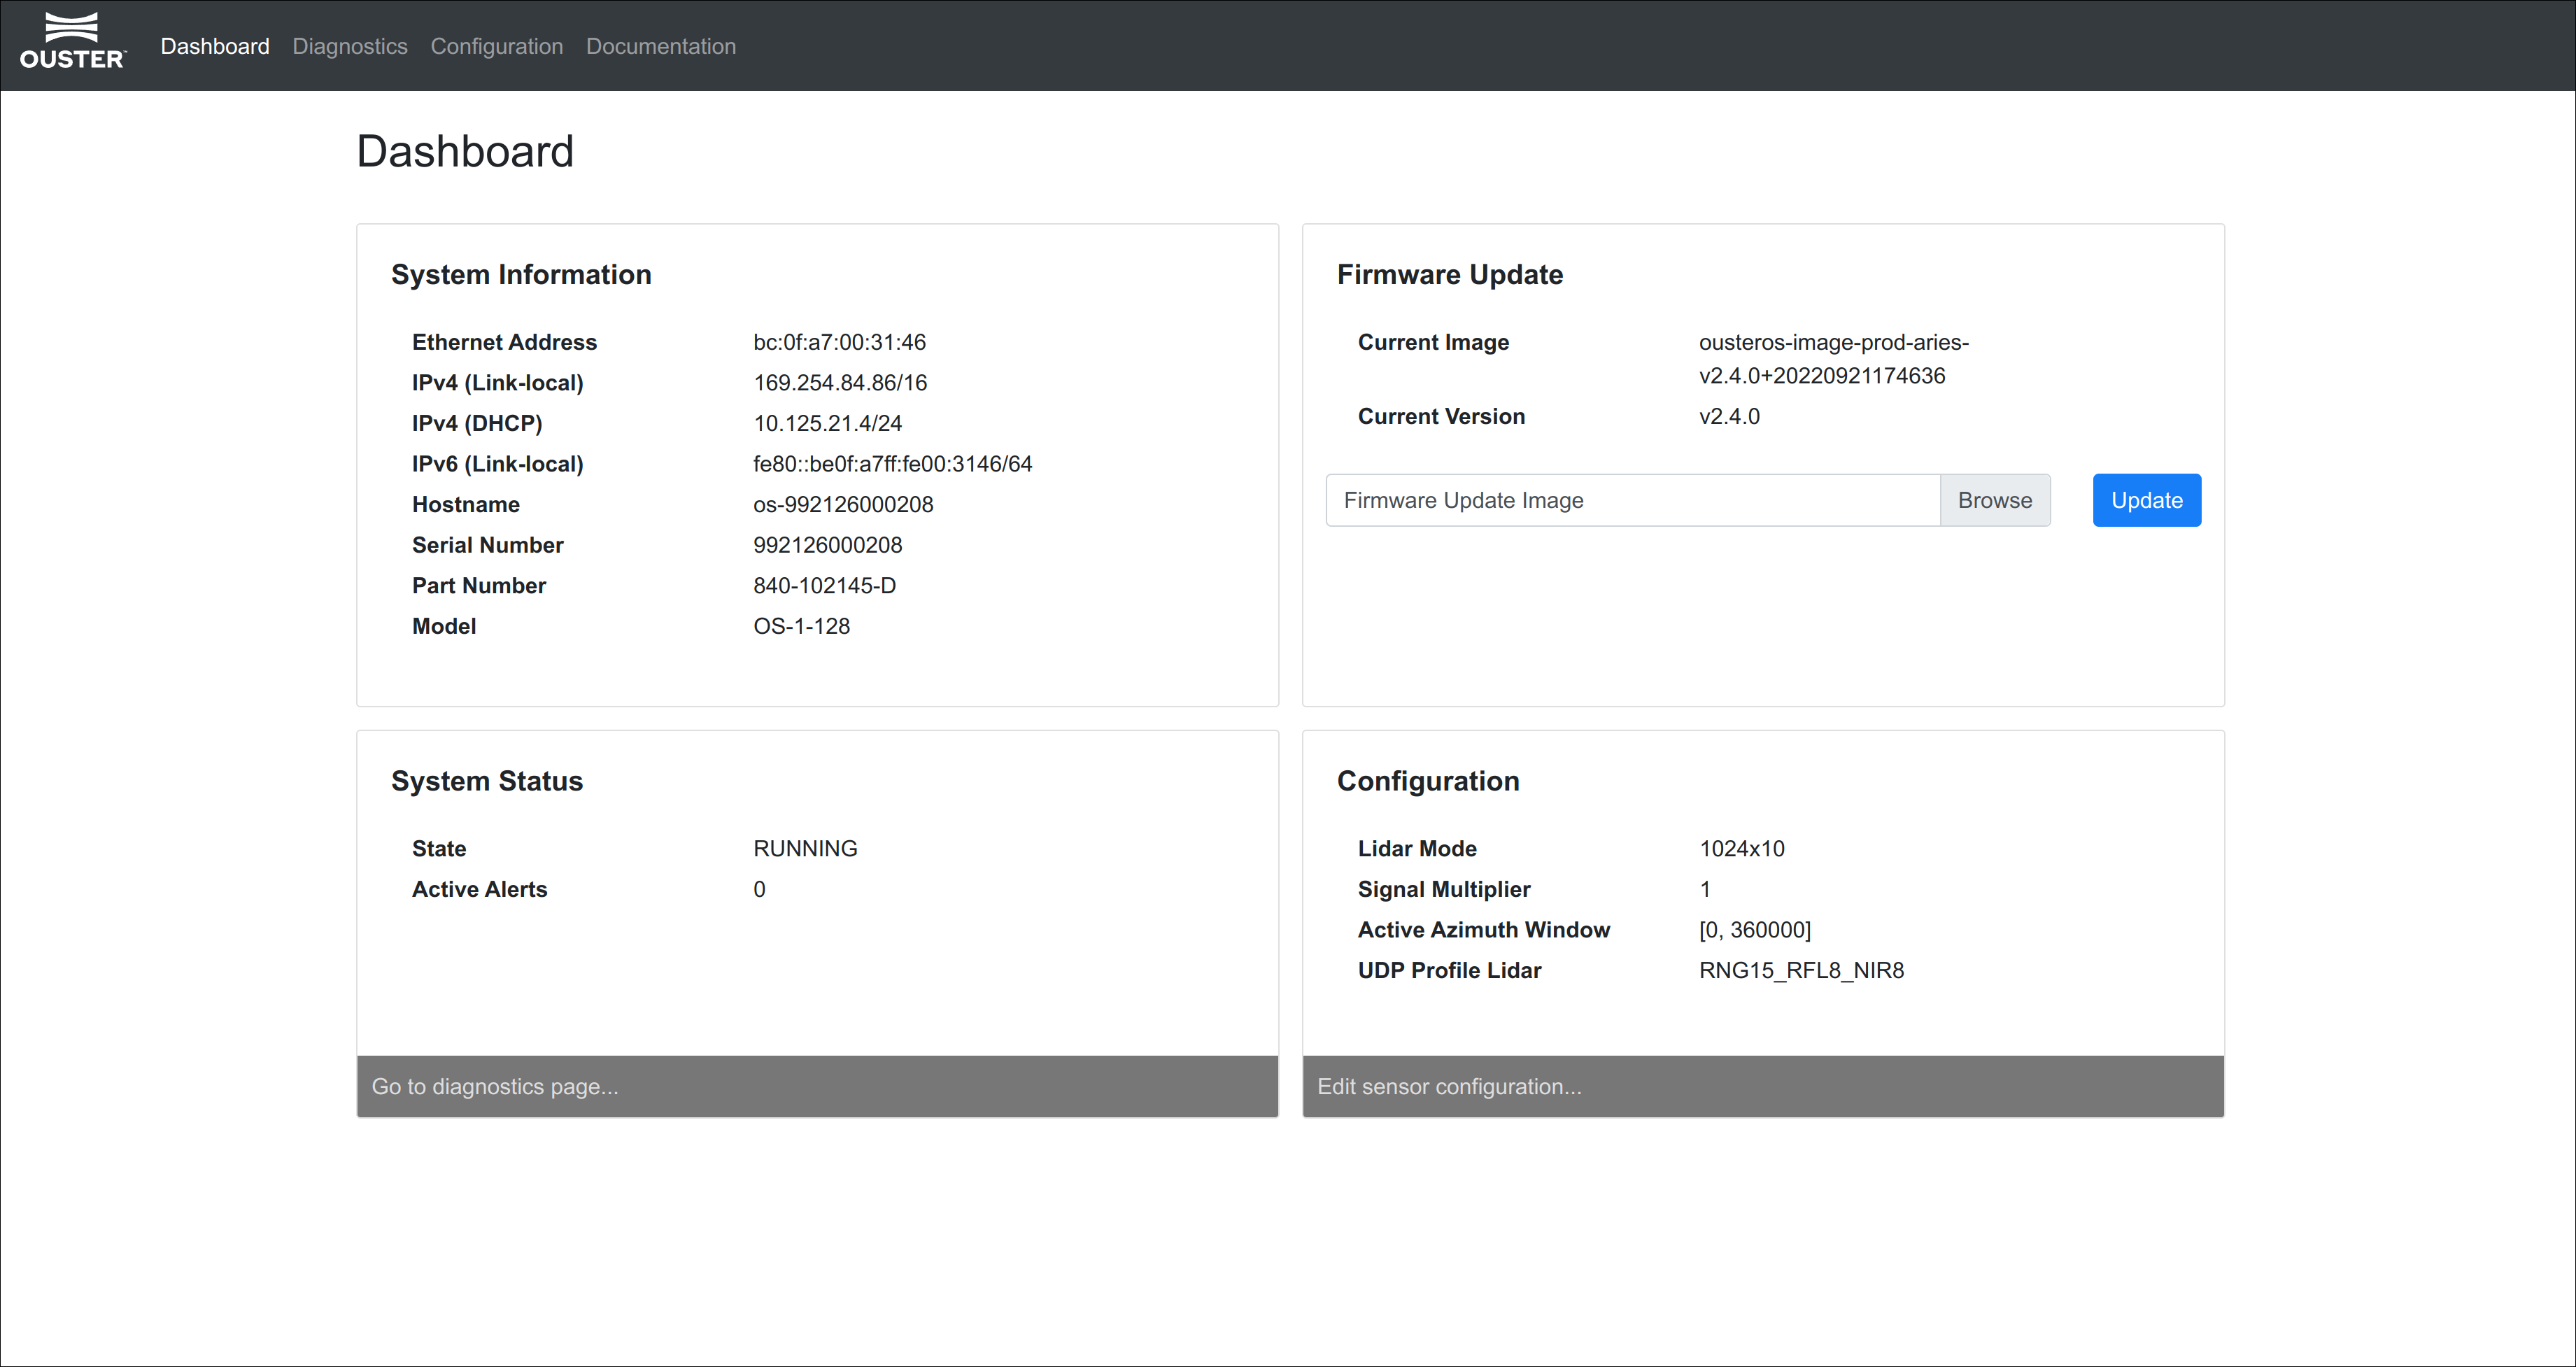
Sensor Configuration Page
New License
Allows the user to add a new license by entitlement ID, or start the offline licensing process. The offline licensing button should be used in the case where a system cannot be connected to the internet. It brings up a form with a locking code, which when provided to Ouster can be used to obtain a device specific locking key.
Sensor Licenses
Displays the current licenses available on the system along with the number activated, remaining and expiry date. There is a section for each license.
Right pane - Setup
Lists options for the sensor and zones
Sources: Lists connected sensors and actions to store or align them.Zones: Lists created zones and options to modify their properties.Underlay: Used to manage the visual background of your 3D scene.Map: Integrates the system with geographic data, typically using Google Maps.AODs: (short for Areas of Detection) Defines Areas for detection.
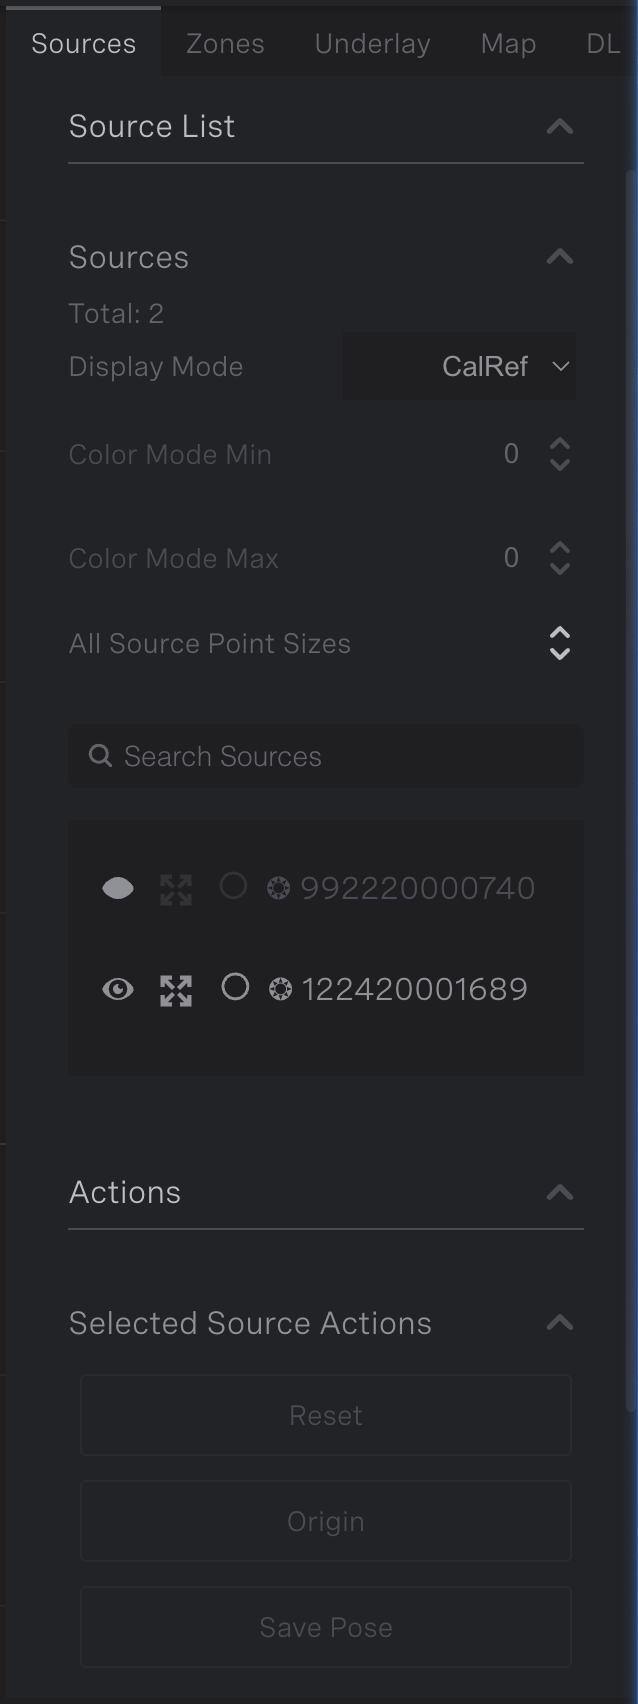
Sources |
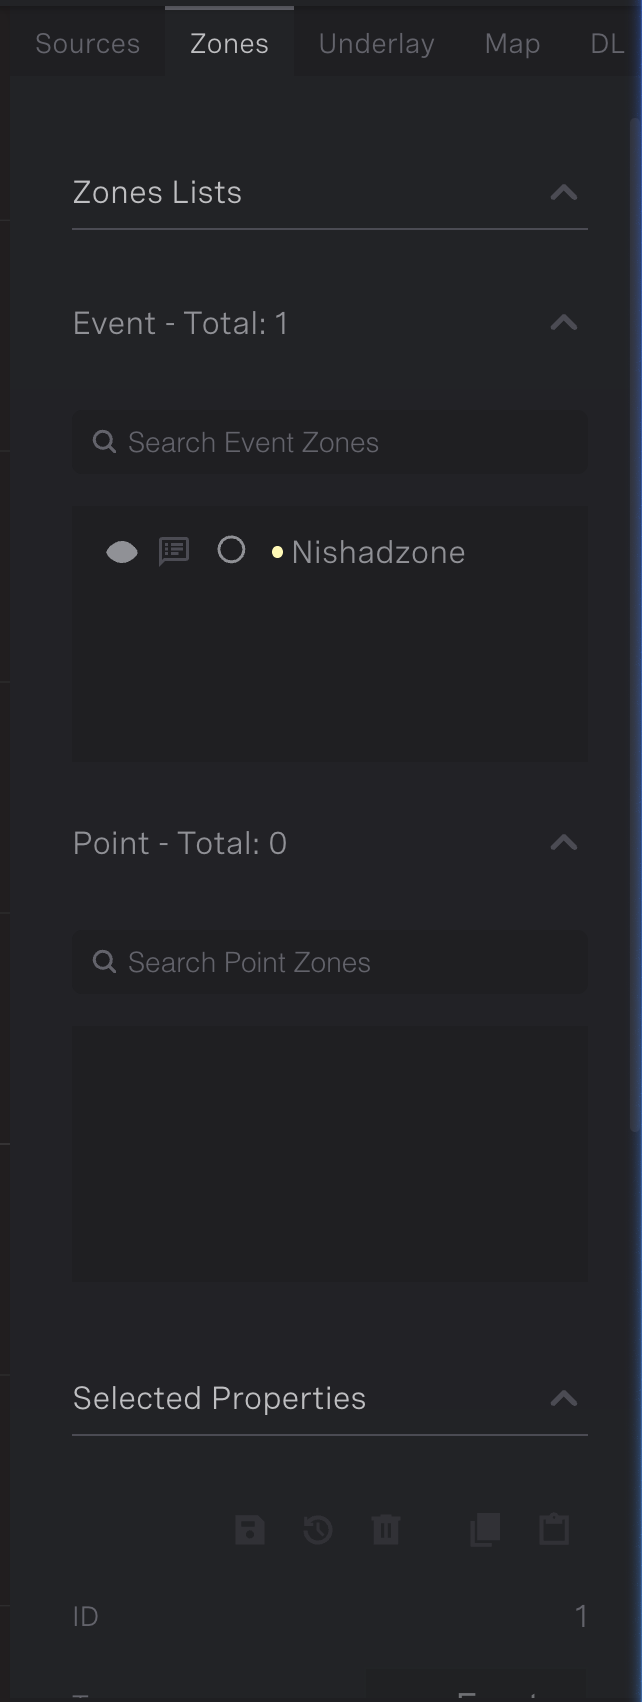
Zones |
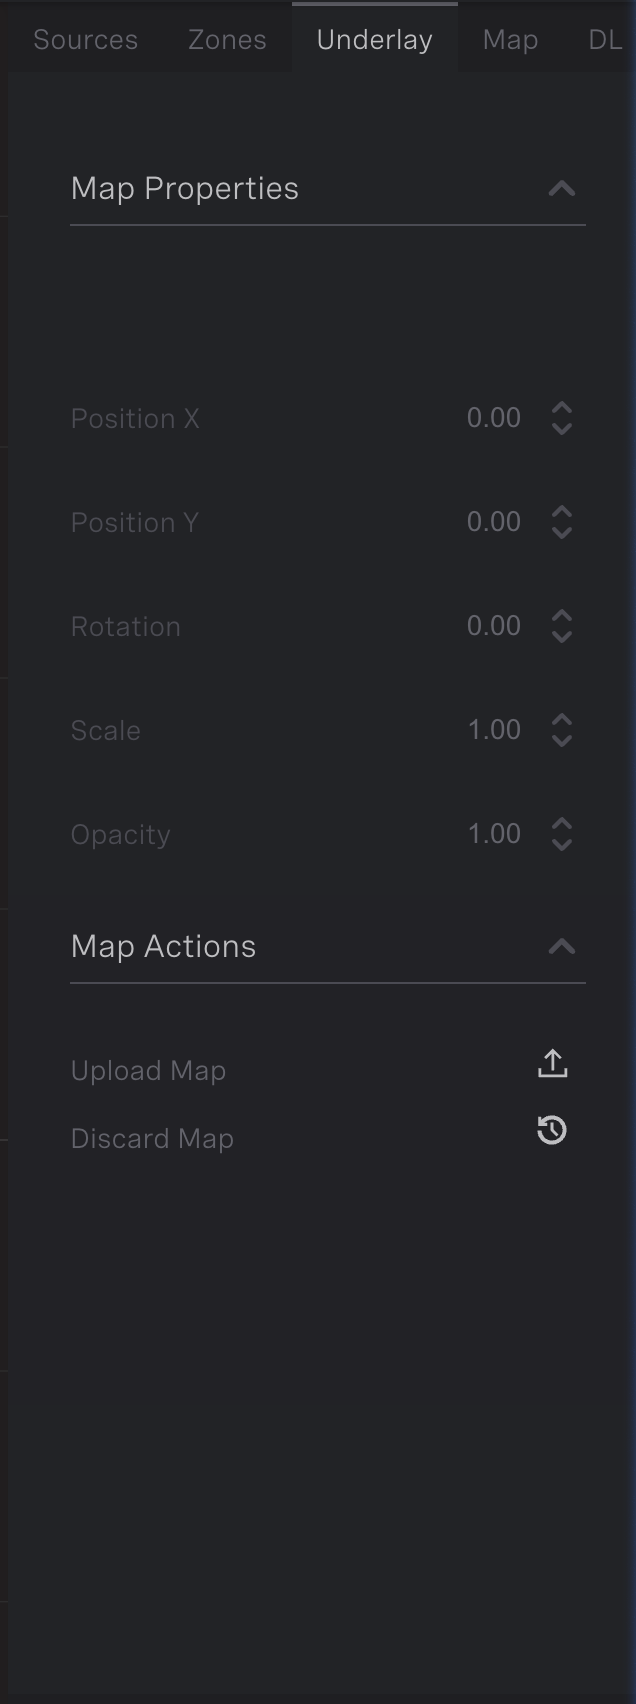
Underlay |
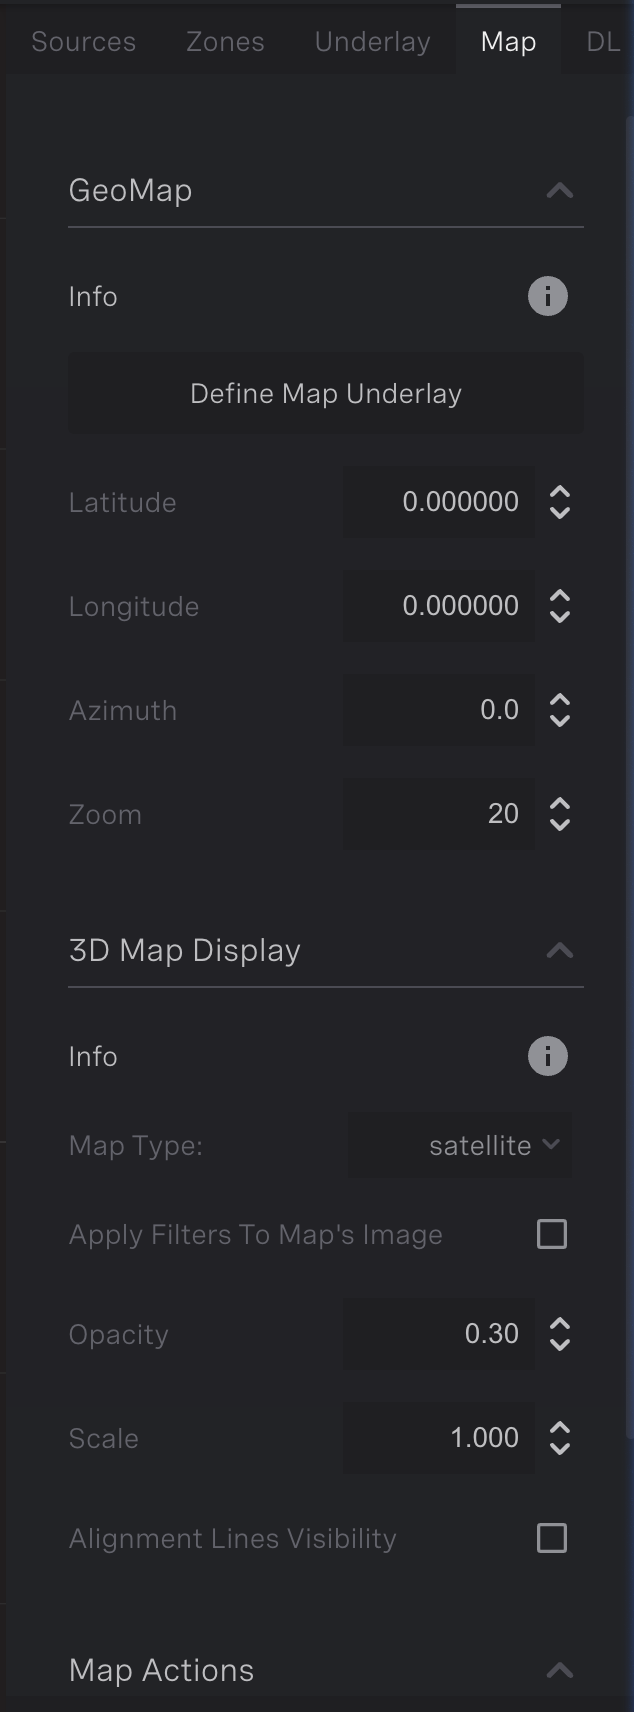
Map |
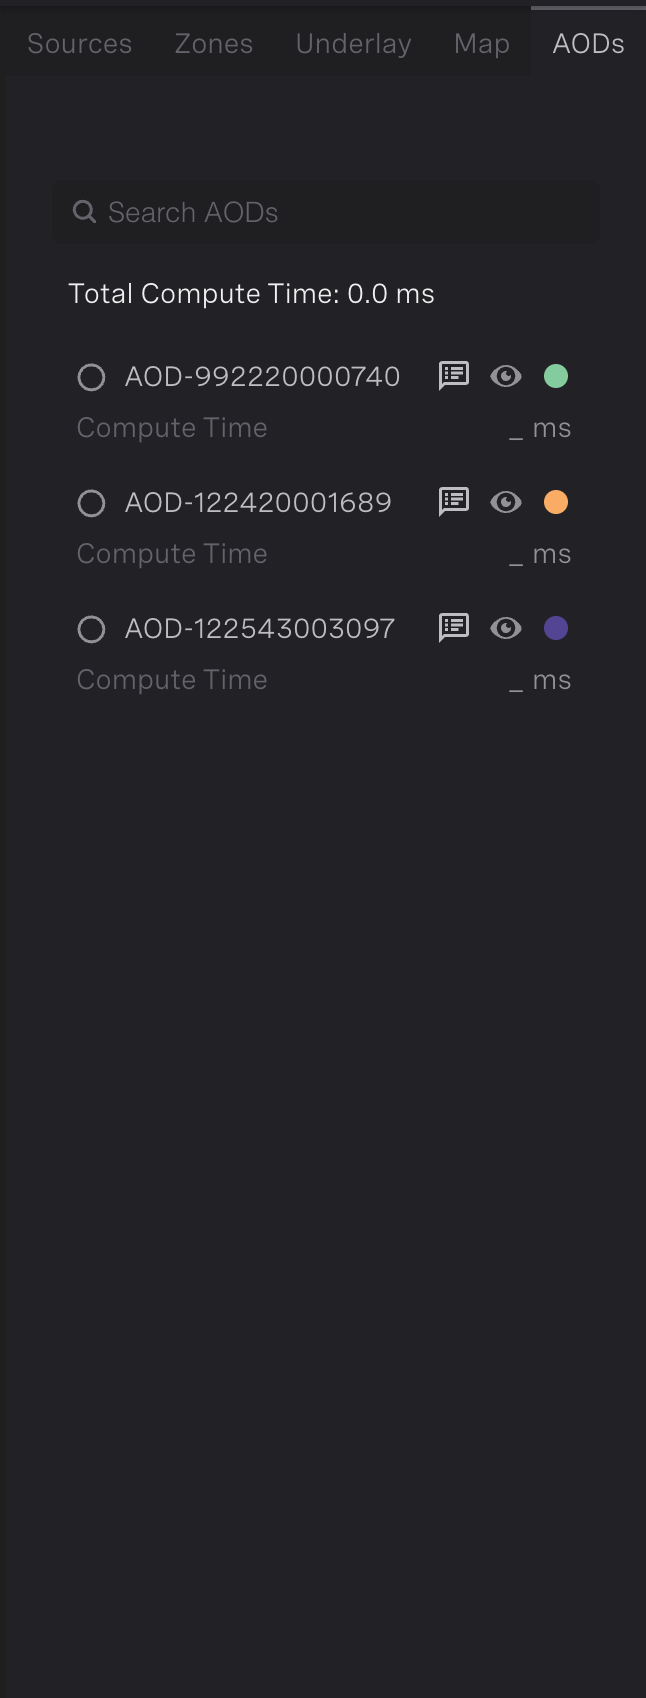
AODs |
Sensor Alignment Tools
After sensors have been added to Ouster Gemini Detect, the next step is to align the sensors. The right panel shows a list of attached sensors to Ouster Gemini Detect. Each sensor has three buttons:
Toggle visibility
Set as Reference
Adjust Transform
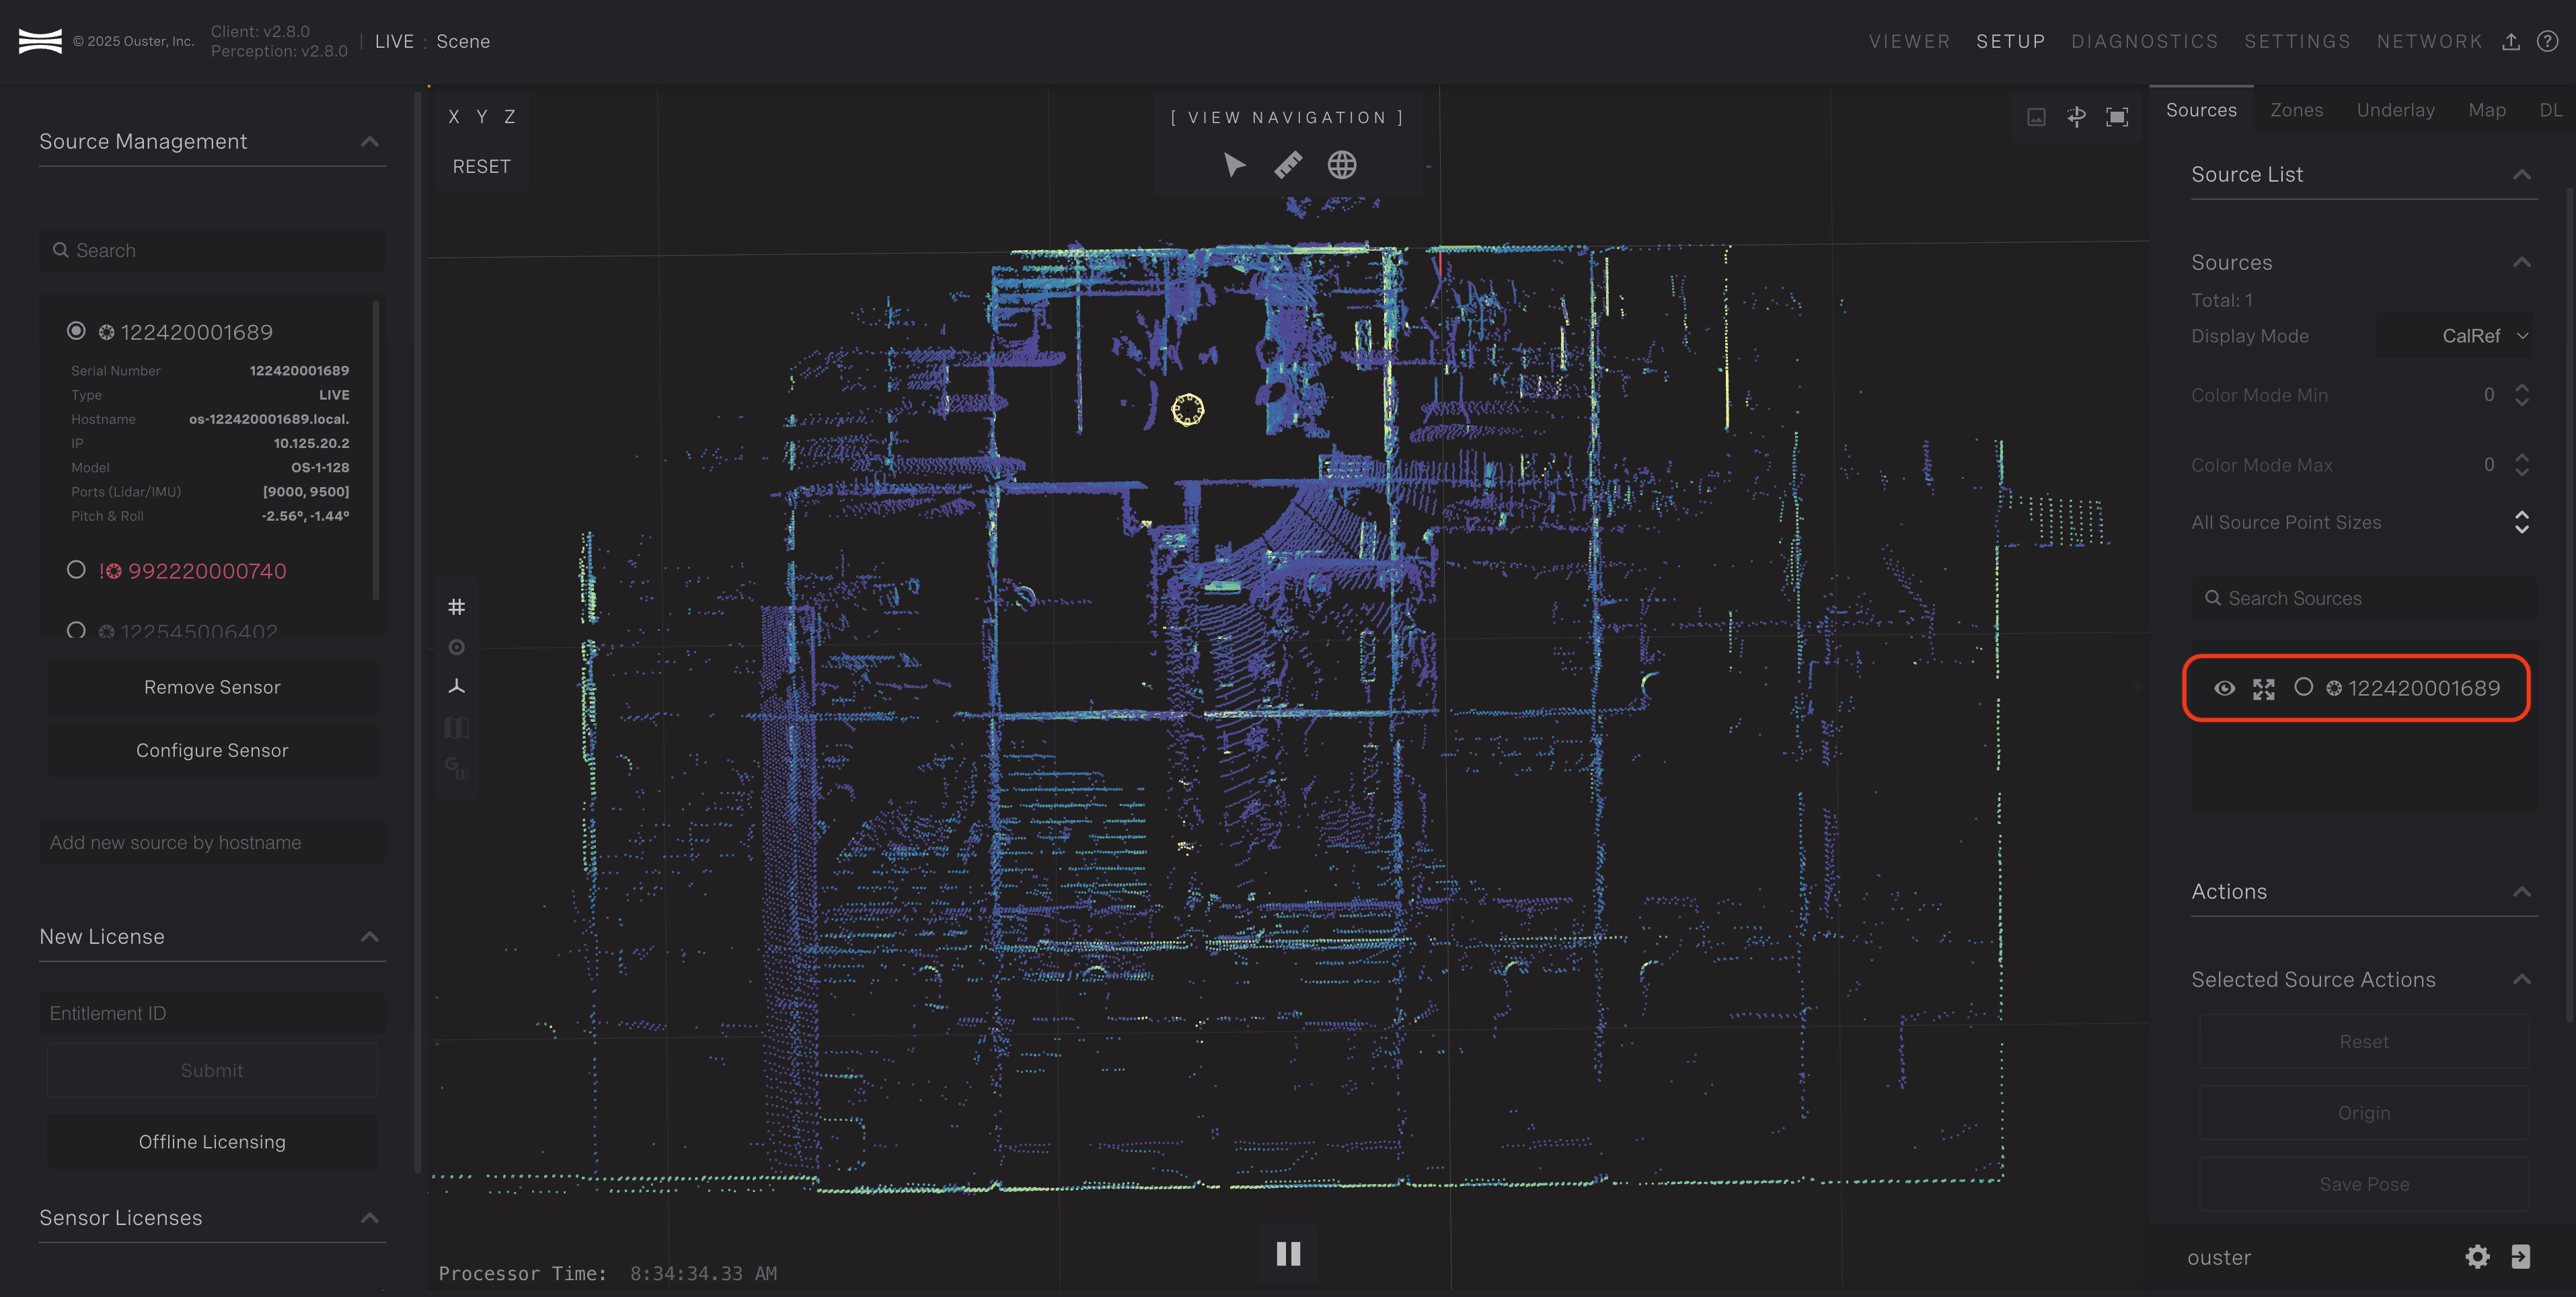
Sensor Alignment Buttons
Using the Alignment Tool
Upon clicking on Adjust Transform, the selected sensor can be aligned for proper visualization.
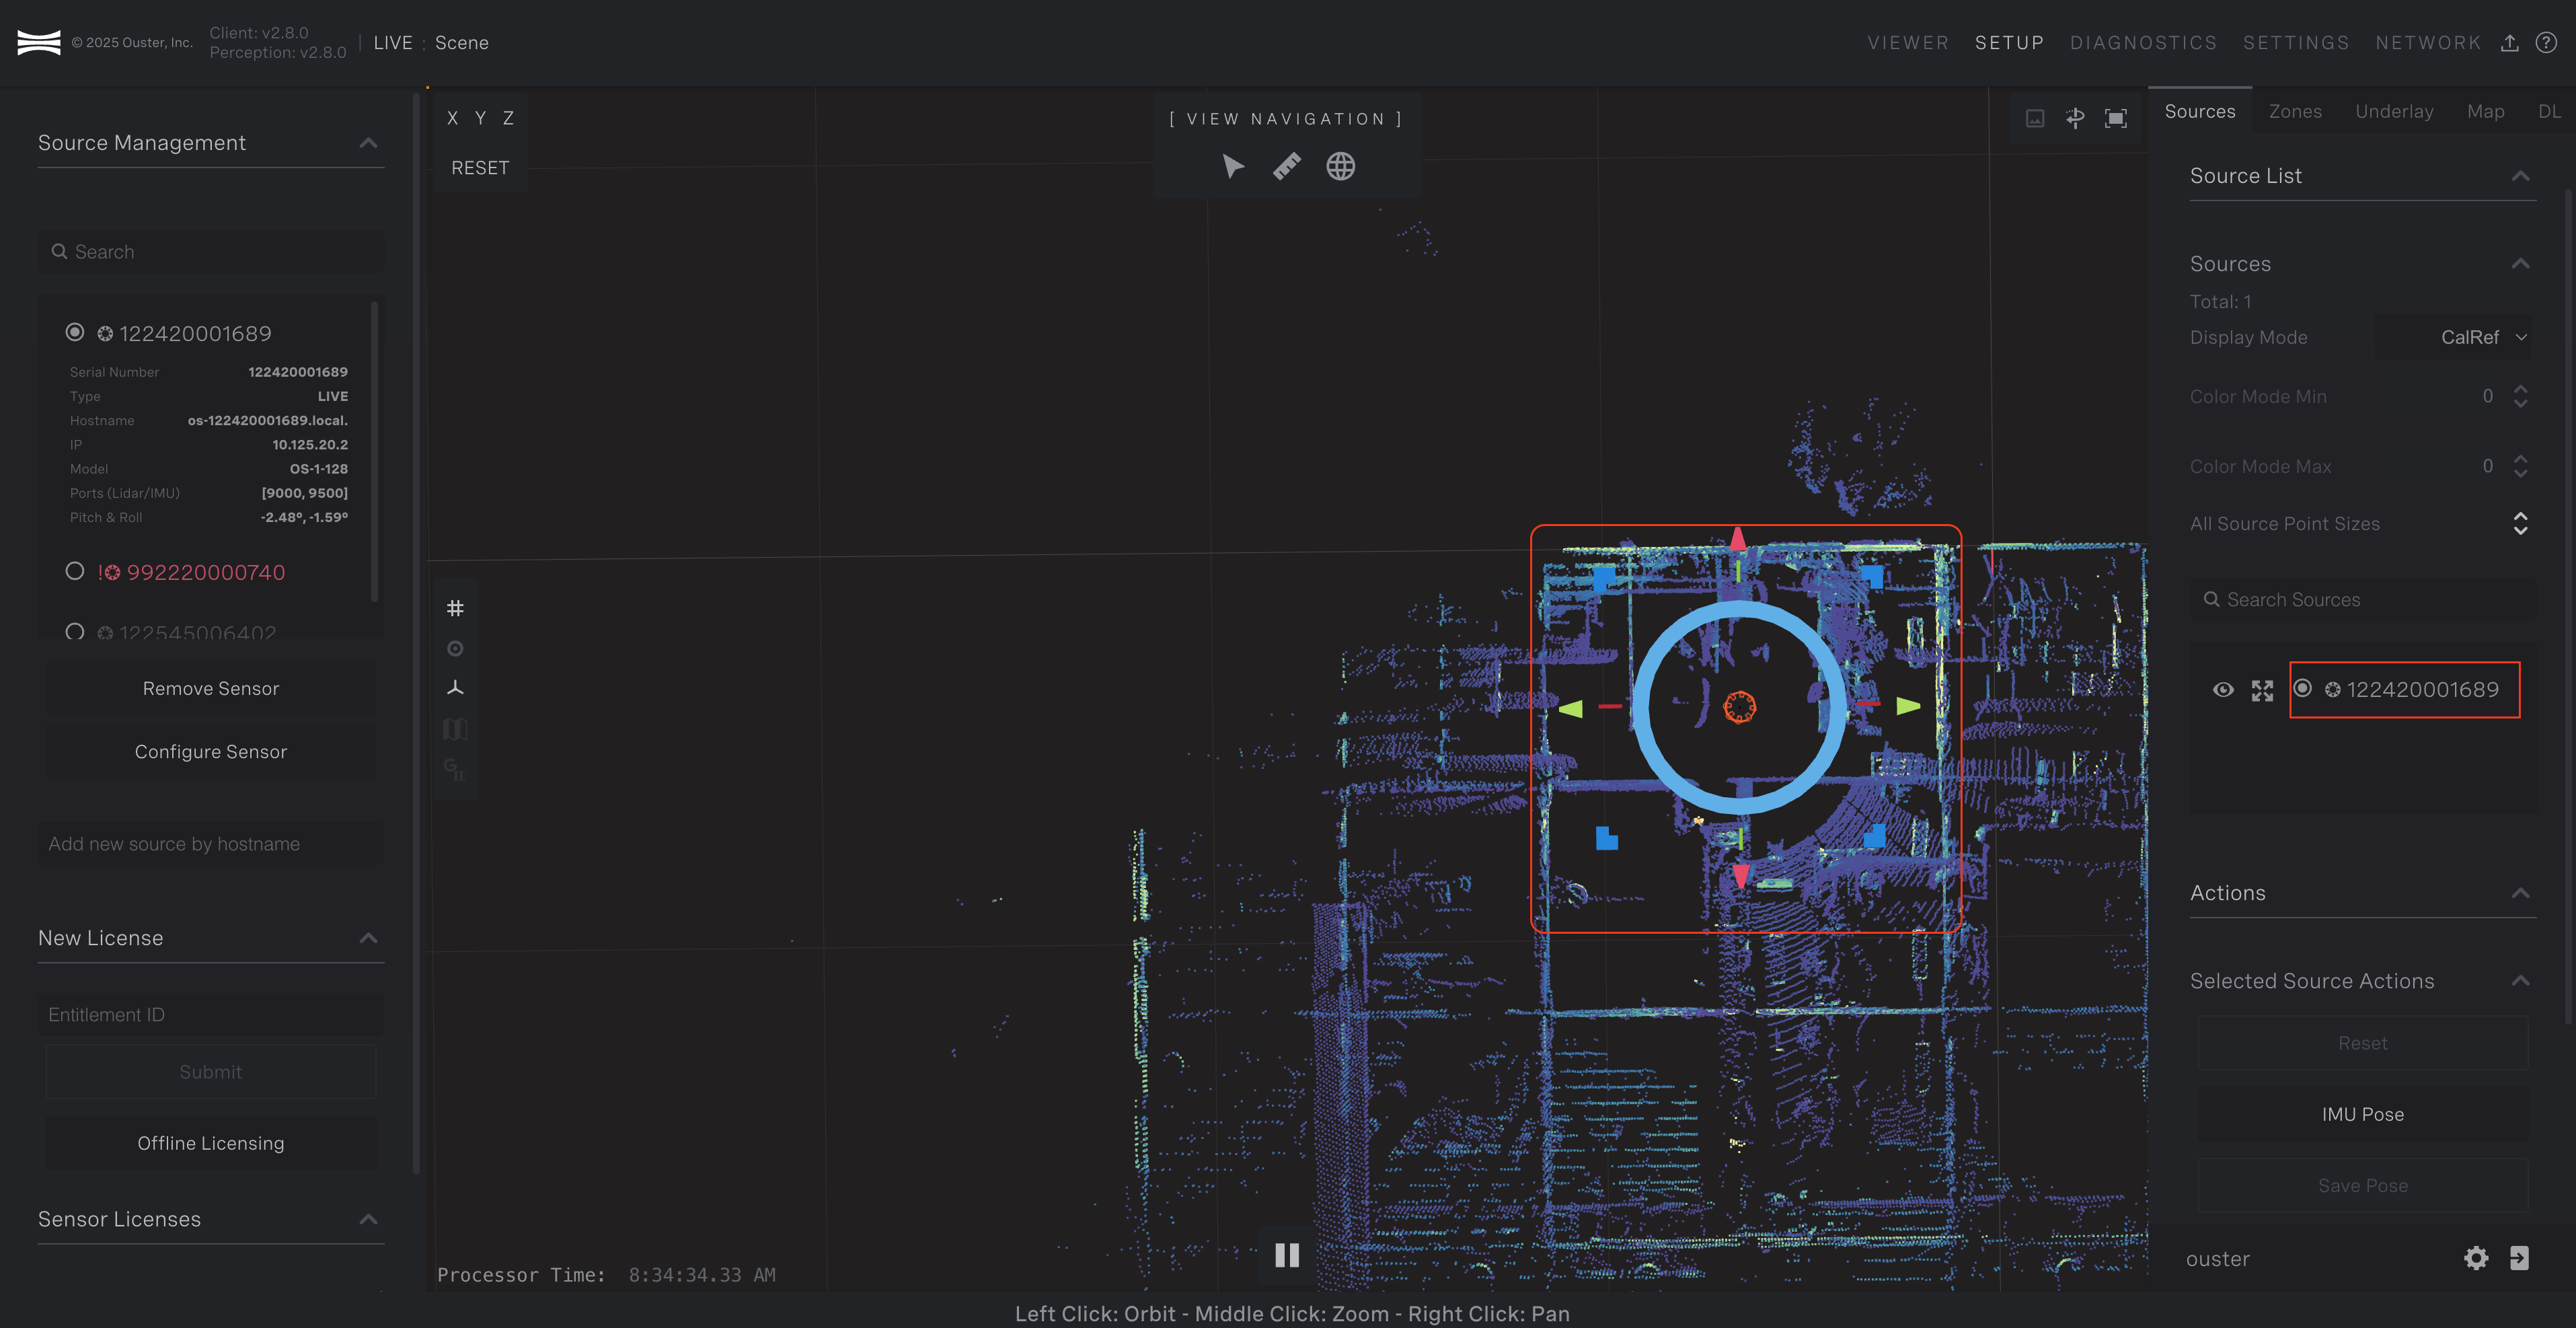
Adjusting transform of a sensor
The alignment tool allows you to translate or rotate the point cloud:
Translate: Click, hold, and slide the arrows to move the cloud.
Yaw Rotation: Click, hold, and slide the horizontal circle.
Pitch & Roll: Press the hotkey
Lto toggle the visibility of the pitch and roll circles (hidden by default).
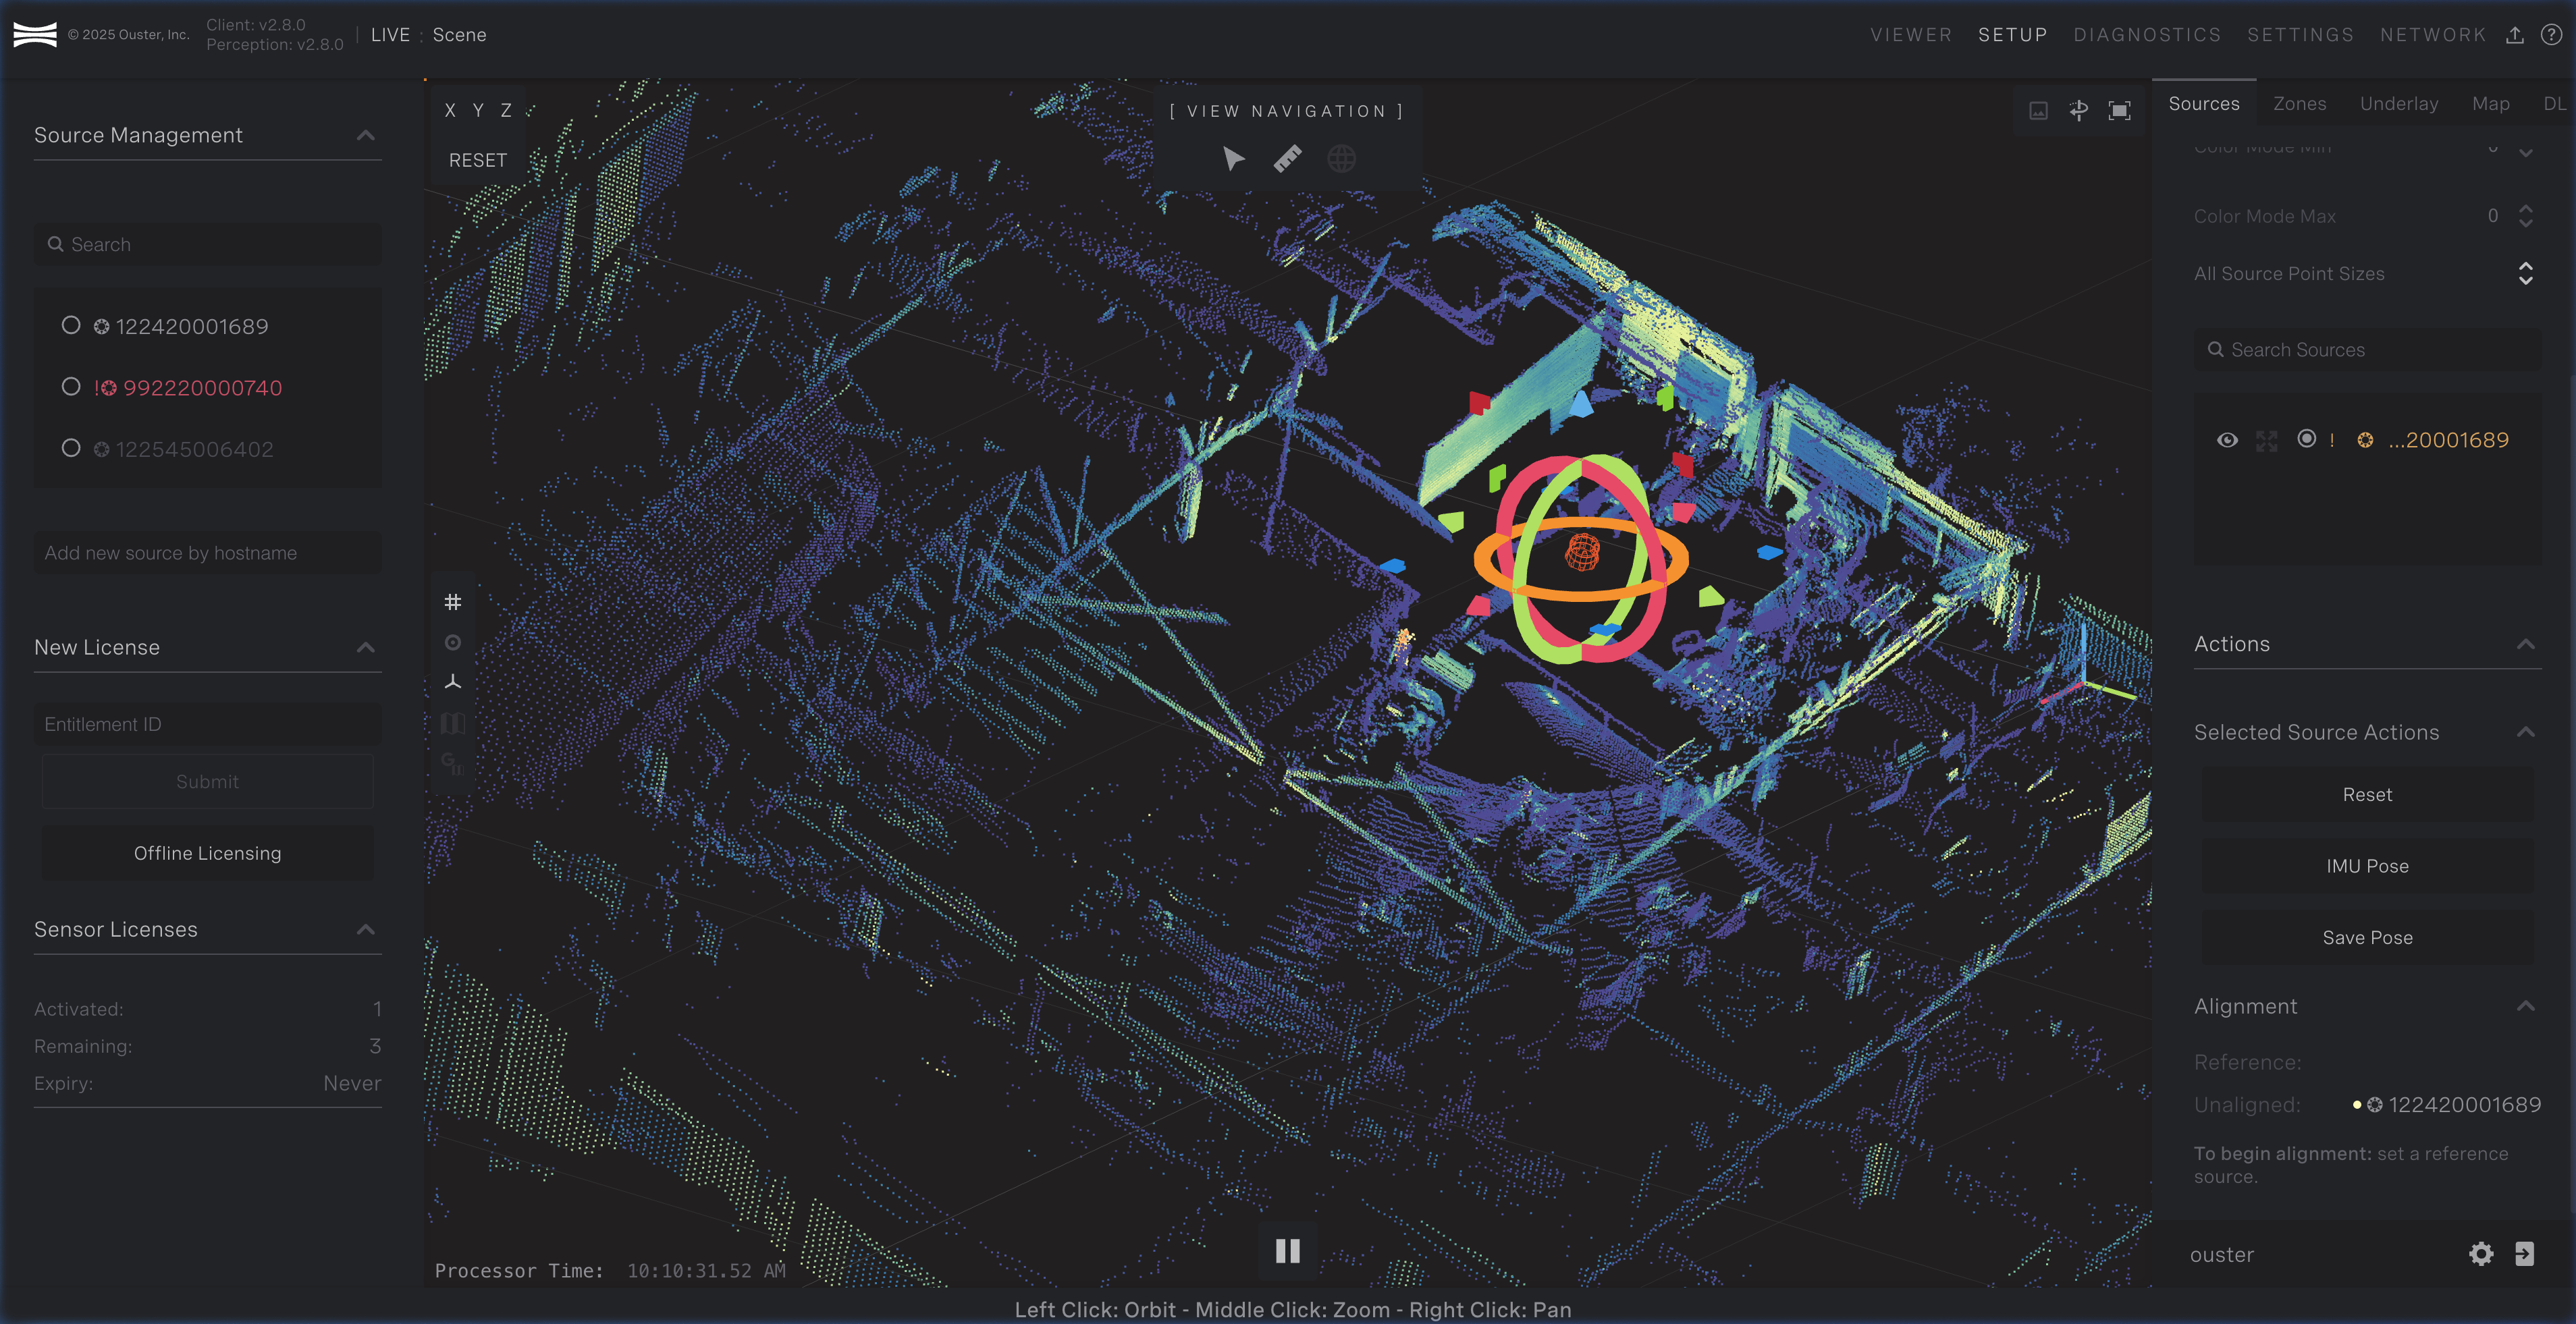
Pitch, Roll and Yaw for sensor alignment
Aligning the Ground Plane for Detect DL, the point cloud must align with the ground plane (the grid where Z equals 0).
Select a Sensor: Click the sensor you wish to adjust.
Orient the View: Click the X or Y in the top-left corner of the 3D display to switch to a side profile view.
Adjust Height: Drag the vertical arrows to move the sensor up or down until the point cloud ground lines up with the grid.
IMU Pose and Pitch and Roll Alignment
Refining Alignment with IMU Pose button uses gravity data to orient the sensor’s Z-axis vertically. Because IMUs have slight measurement errors, manual fine-tuning is recommended for multi-LiDAR setups.
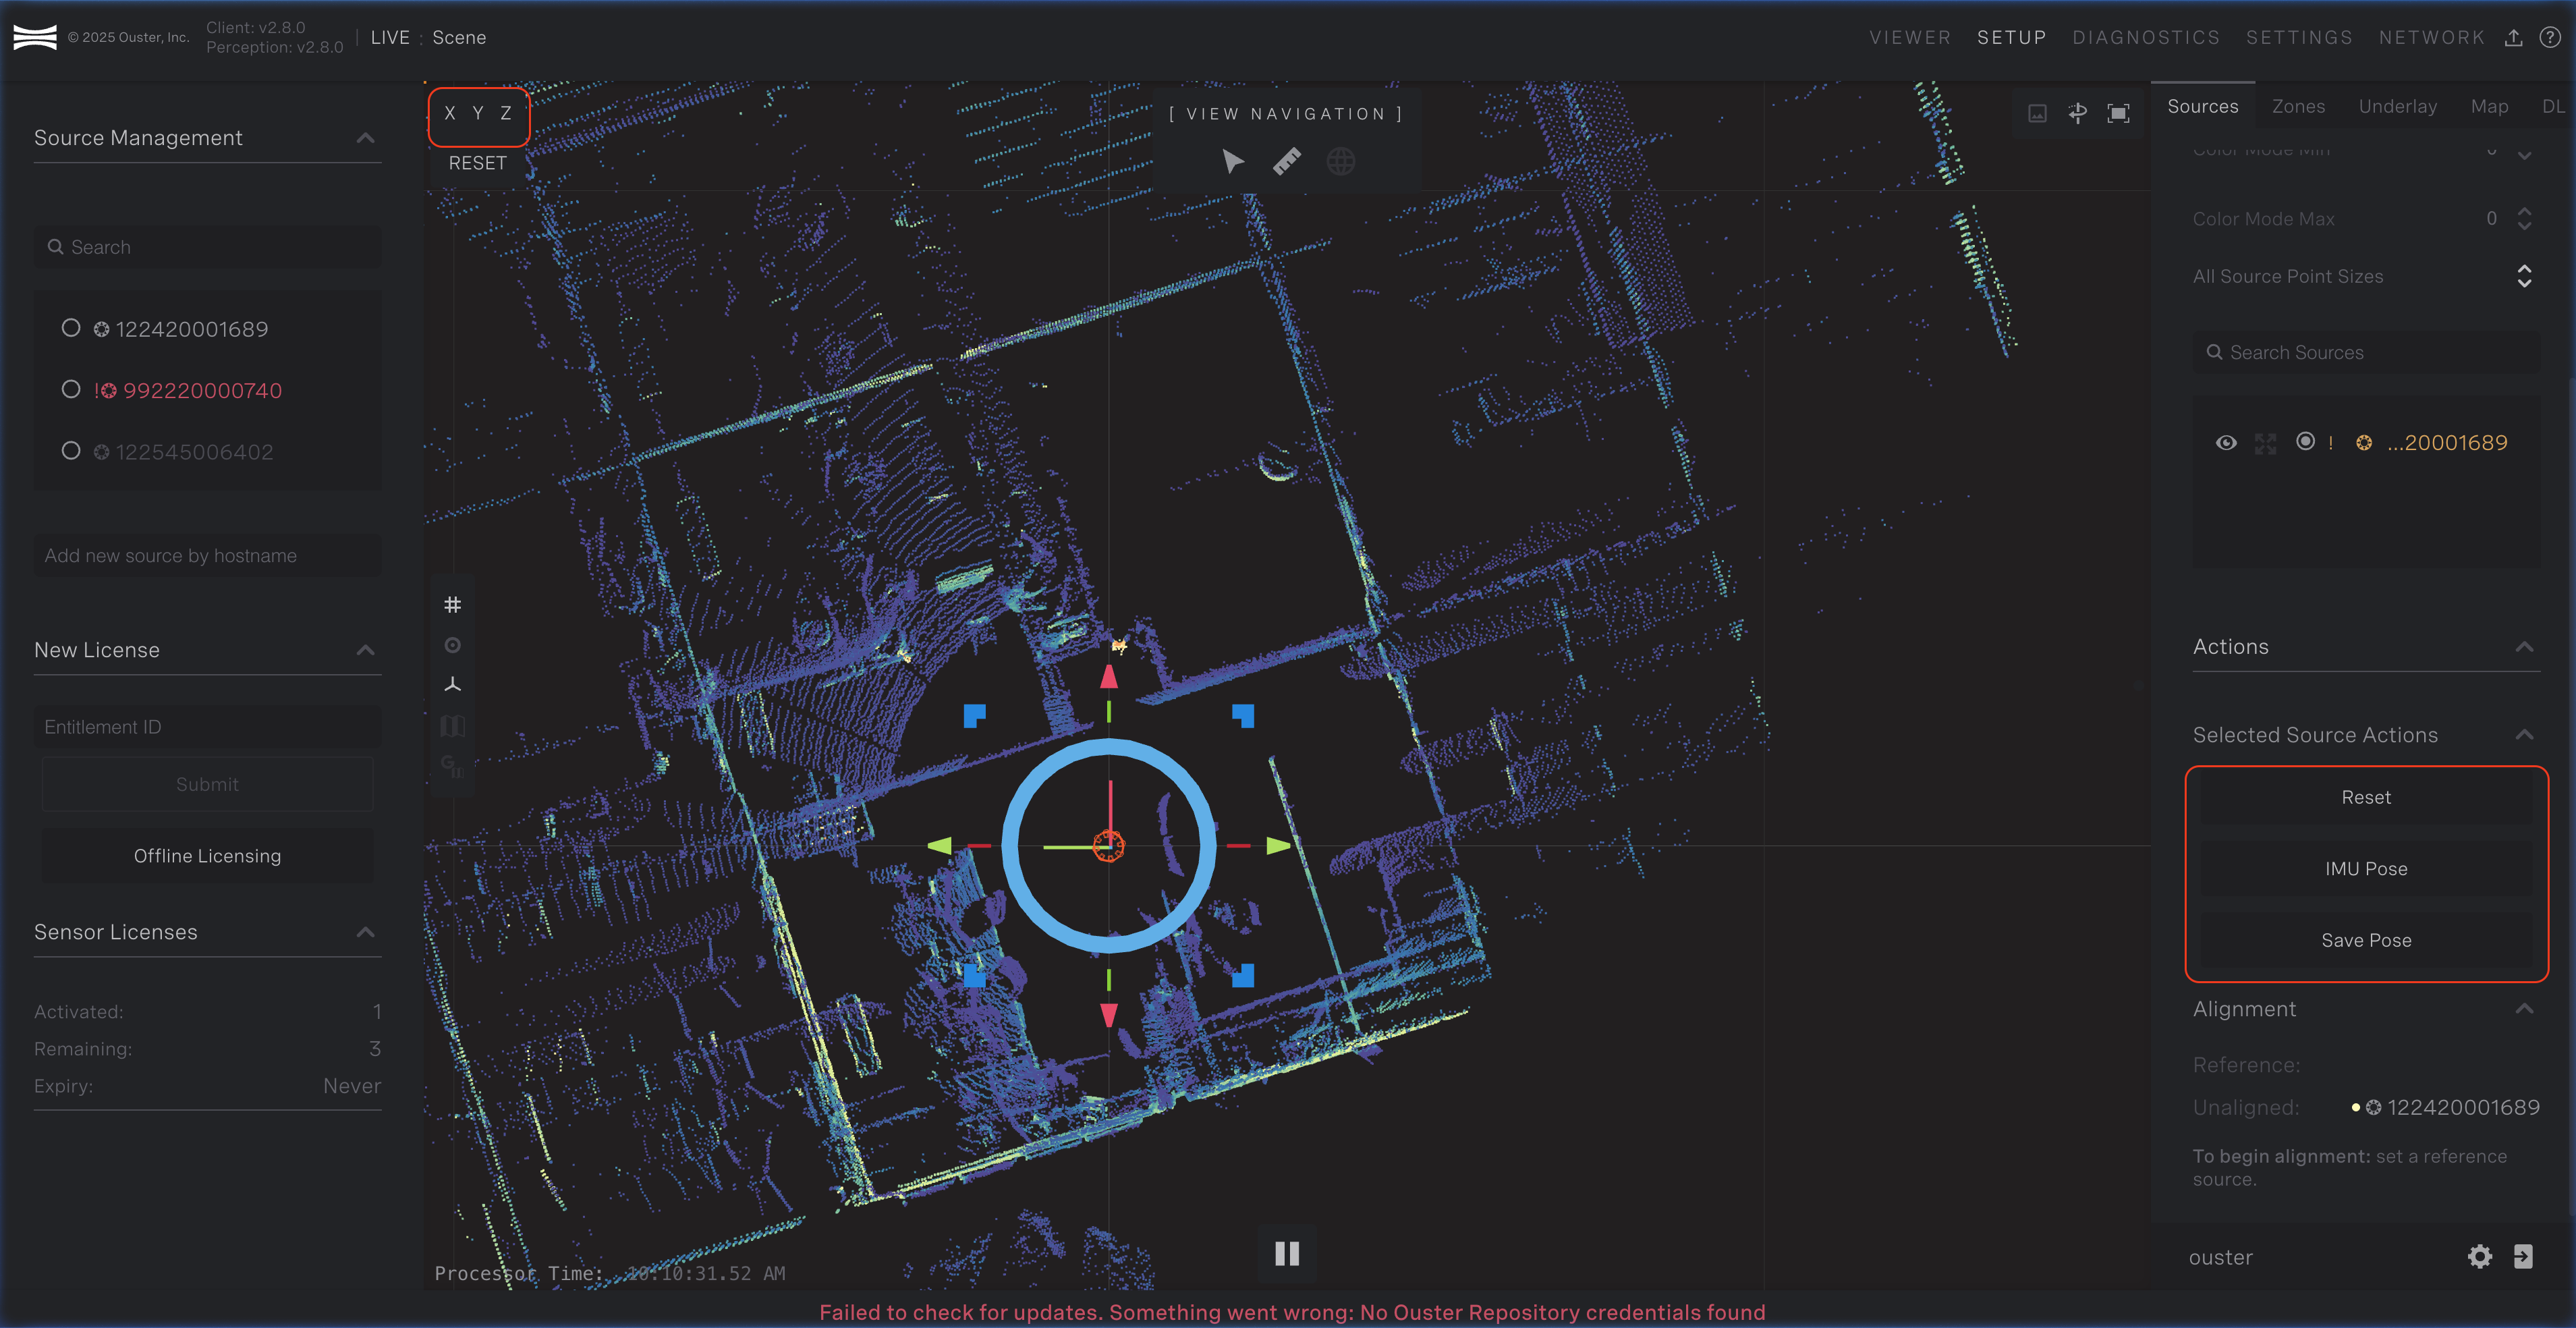
IMU Pose adjustment to align sensors
Align: Click IMU Pose to set the initial vertical orientation.
Correct Roll: Click X to switch to the side view. Press
Lto display the rotation circles. Adjust the roll until the cloud is level.Correct Pitch: Click Y to switch to the opposite side view. Adjust the pitch using the alignment tool until precise.
This manual calibration ensures that point clouds from different sensors overlap perfectly.
Automatic Alignment Tool
To use the Automatic Alignment Tool, follow these four quick steps:
Rough Align: Manually move the sensors so their point clouds roughly overlap.
Set Reference: In the right panel, click Set as Reference on the cloud that should stay put.
Select Target: Click Adjust Transform on the cloud you want to move.
Align: Click Align in the right panel. The process takes about five seconds.
Sometimes, the tool may converge to a incorrect transform. In this circumstance, click Reject to reverse the alignment. Retry the automatic alignment again, and if it still fails, then resort to aligning using the manual alignment tool, or try again after better aligning the two clouds.
Saving and Resetting Transforms
To return the cloud to its original position, click Reset to return to the cloud to its originally saved orientation and position. To save the transform, click Save. This will save the cloud’s position to disk and will be updated in the viewer pane.
Map Configuration
The location of objects with respect to the world can be configured with the
Map tab. The Map tab enables you to set the lat/long coordinates of the world
reference frame with the context of a satellite or roadmap image. This context
is also made available when aligning sensors and viewing the object list. This
context is referred to as the map underlay. In addition to configuring the
map underlay for viewing objects, the lat/long configured through the Map tab
is used to convert the object list position into lat/long coordinates for use
by downstream applications. Navigate to the Map tab by clicking Setup, then
Map.
The Map tab presents a list to settings for the map underlay. These setting include:
Latitude: North-south position as an angle from the Equator
Longitude: East-west position as an angle from the Prime Meridian
Azimuth: In the context of the Detect world reference frame on the Earth’s surface, the azimuth angle is the horizontal angle measured clockwise from a true North reference to the positive x-axis of your coordinate system. Looking down on the coordinate frame from above, an increase in azimuth value corresponds to a clockwise rotation of the positive x-axis away from true North. Azimuth values are accepted between 0 degrees to 360 degrees. We recommend keeping this value at 0 for new installations. We provide this parameter to support sites upgrading to Detect 2.7 where setup was done with a previous version without aligning North with the positive x-direction.
Zoom: Configures the zoom level for the view to the lat/long location. This controls the zoom level of the retrieved Google map. An increase in zoom level increases the resolution of the map. Generally, zoom level between 10 and 20 gives the best results
Map Type: Which map view to show for the map underlay. This can be either Satellite or Roadmap
Opacity: How much transparency to apply to the map underlay. 0 is invisible, 1 is no transparency
Scale: How much to scale the map. The map underlay should be automatically scaled and the default of 1 should be precise enough for most use cases
You can configure the lat/long interactively by clicking the Define Map
Underlay button in the Map tab. This will change the mode to modify the
lat/long, zoom, and area of the underlay with your mouse. The center view will
change to let you choose the desired area. Once you exit this mode, the image
will be pulled from the Google Map service and displayed as the map underlay.
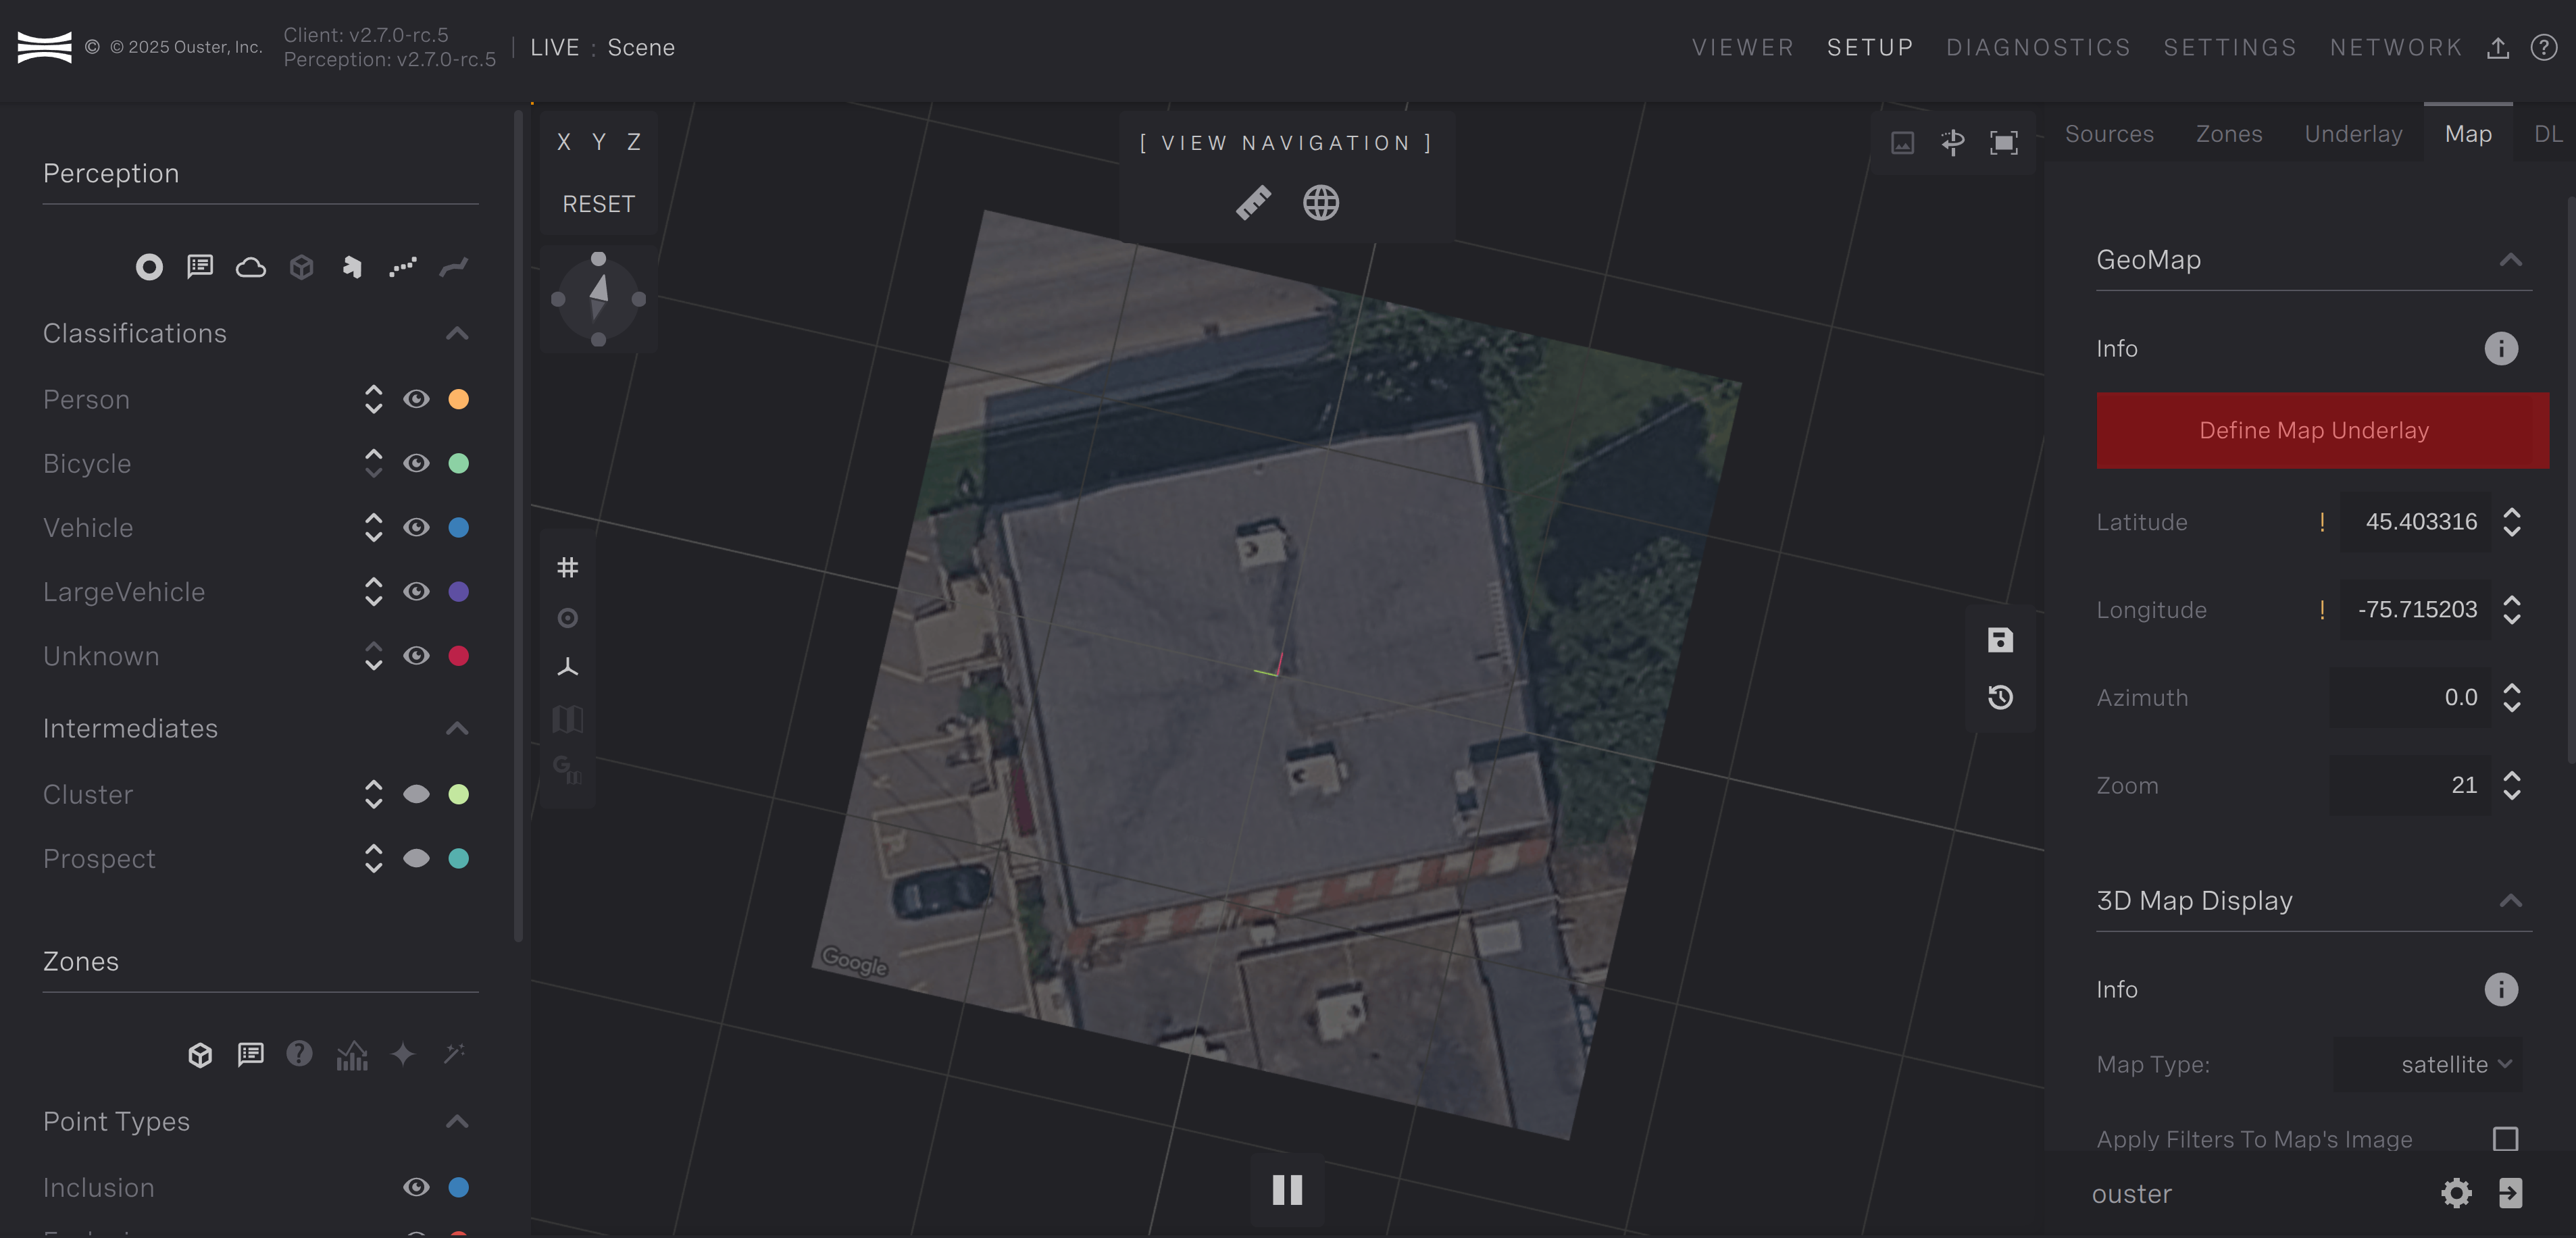
Map configuration page |
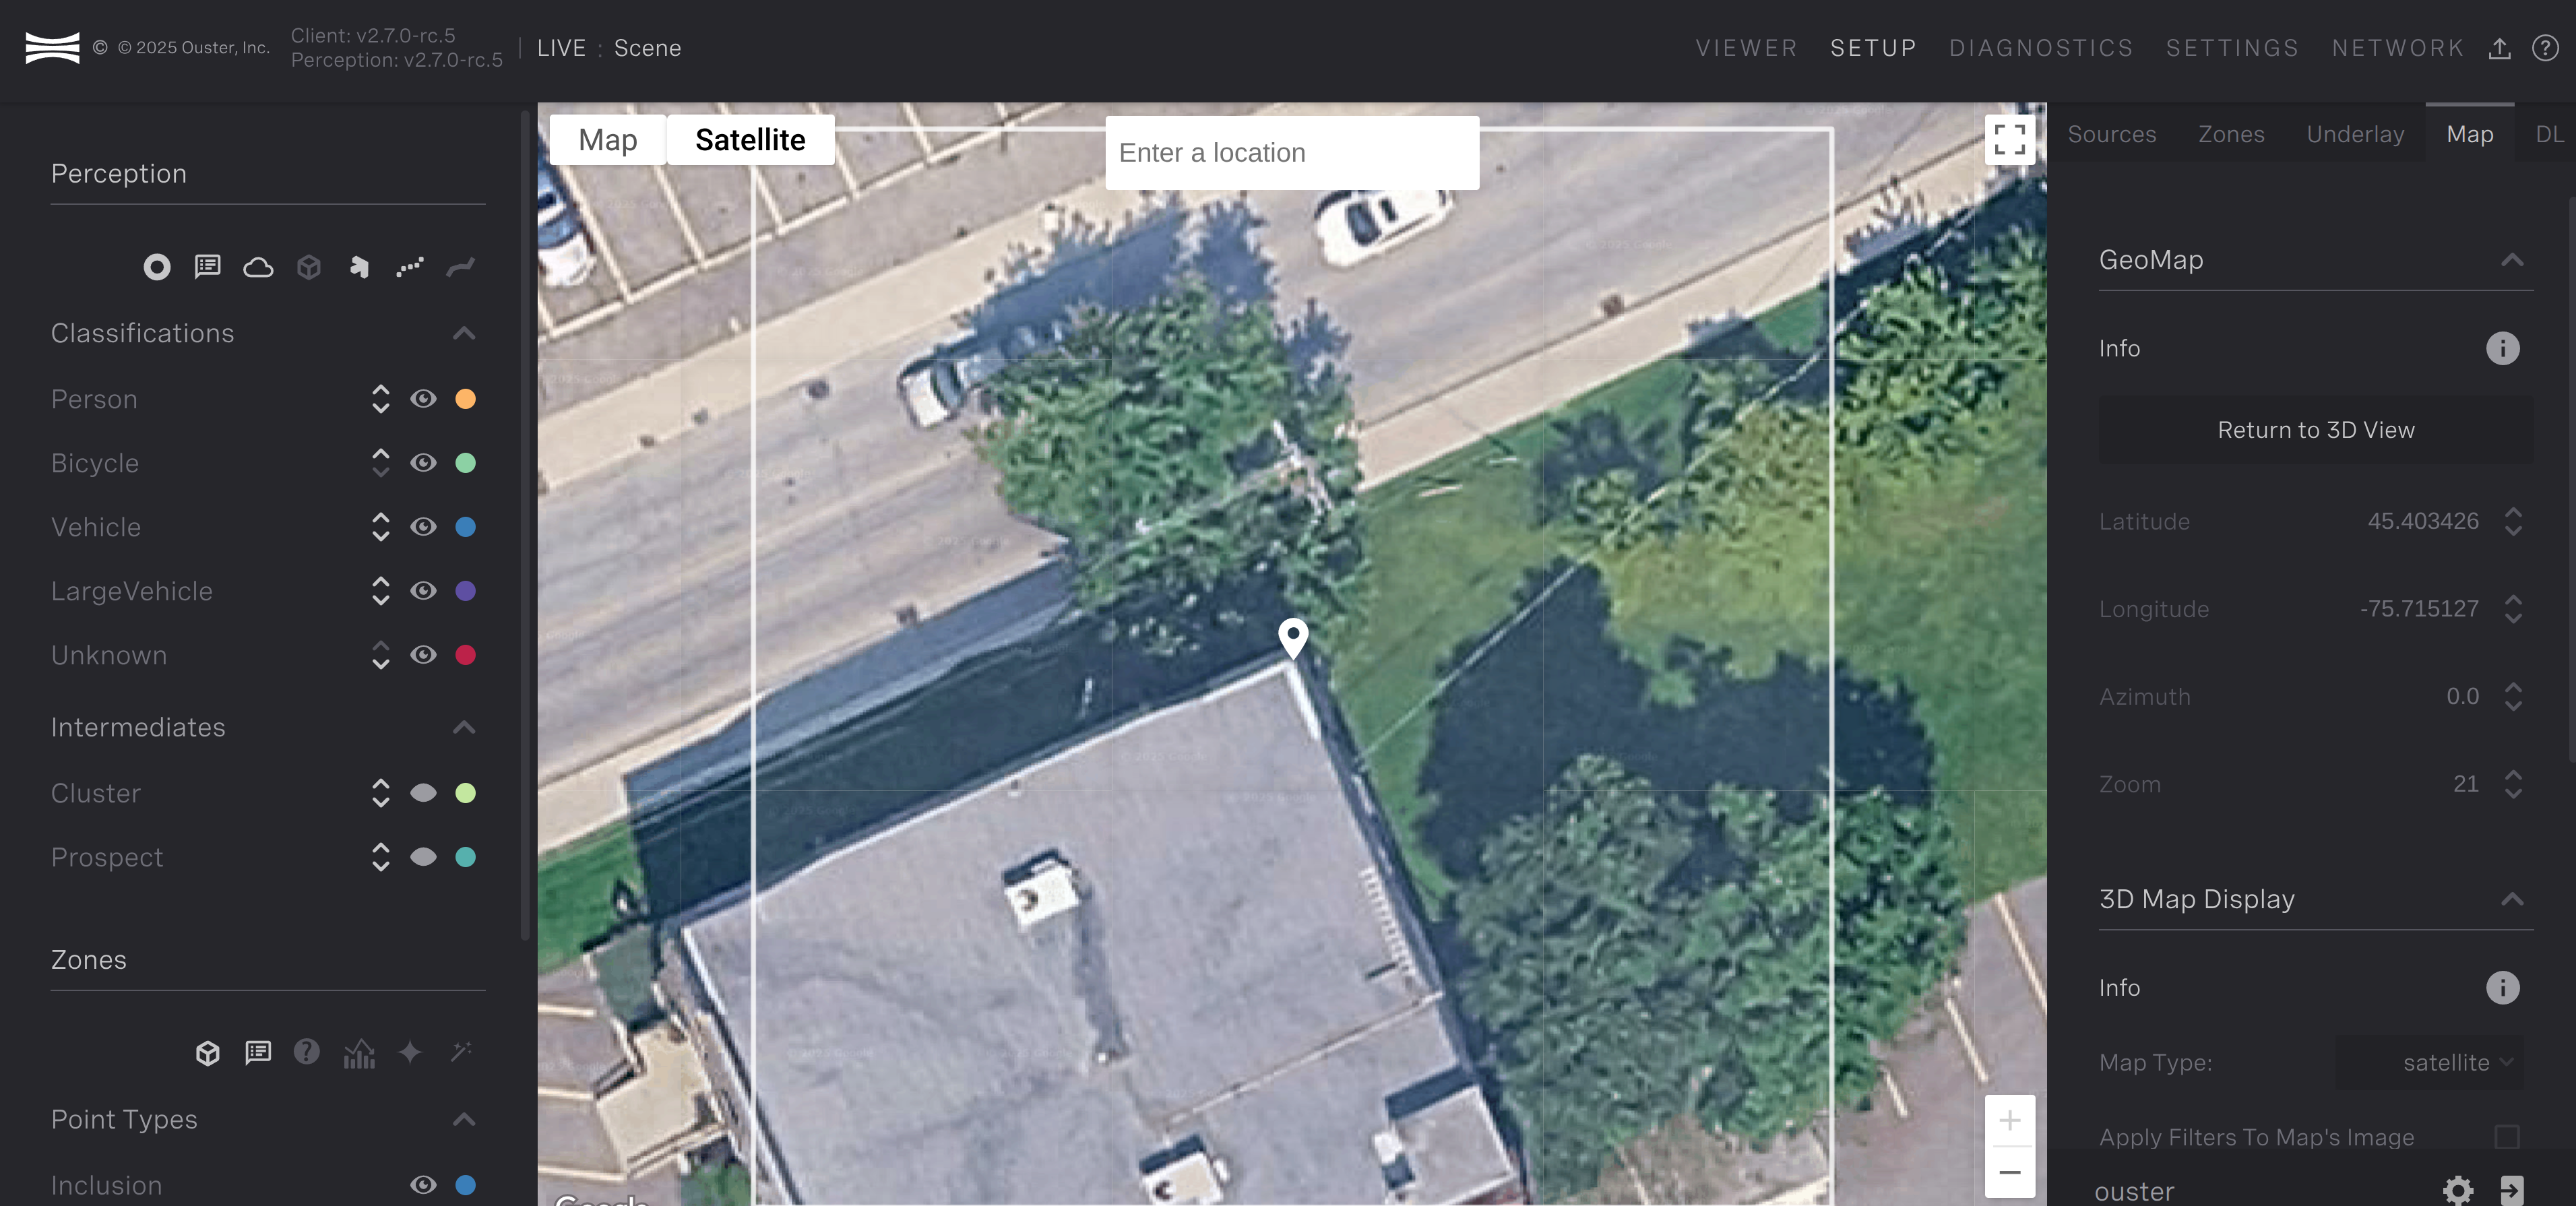
Interactive Map definition page |
You can pan the map view by clicking either mouse button and dragging until the white pin is in the location you want for the world reference frame. You can scroll with the mouse wheel to zoom in and out to find the right zoom level appropriate for your scene. The area for the map underlay will be the area contained in the white square. The area in the white square should fully cover the area you’re trying to detect objects in with Gemini Detect.
Click the Return to 3D View button to exit this mode and see the 3D
object view again. If you have sensors added and aligned, you’ll see objects
overlayed onto your map.
The lat/long, azimuth, and zoom can also be configured under the GeoMap
properties under the Map tab. The 3D Map Display properties can be used
to configure the appearance of the map underlay if desired.
Gemini Detect will automatically scale the map underlay. If you observe
inaccuracies in this scaling, you can use the Scale parameter to increase the
size of the map underlay. In this situation, Detect provides some helper lines
which are set at 10m increments. These lines can be used to compare with
measurements in the real-world for calibration. Enable Alignment Lines
Visible to show 10m increments.
To save any configuration to the map underlay settings, click Save Map Settings.
Note
Saving the map settings requires the lidarhub to restart which can take up to 10 seconds.
Note
If you’ve already added sensors and drawn zones or configured AOD’s, you can use the world tool to transform the sensors, zones, and AOD’s to the correct location with respect to a new world reference frame if you need to change the lat/long. See World Tool for more details.
World Tool
The world tool can be used in both the Sources and Map tab on the
Setup page. The world tool allows you to transform the aligned sensors,
event zones, inclusion/exclusion zones, and ML AOD’s all at once. This is
useful if you want to change the position/orientation of the world reference
frame but the sensors, zones, and/or AOD’s are in the correct places relative
to each other. The world reference frame is tied to the lat/long in WGS84
coordiantes configured in the Map tab.
The world tool presents the same controls as the tool to move the individual sensors and zones. To enable the world tool, click the globe icon in the top-center pane. The transform controls will appear allowing you to move the entire scene.
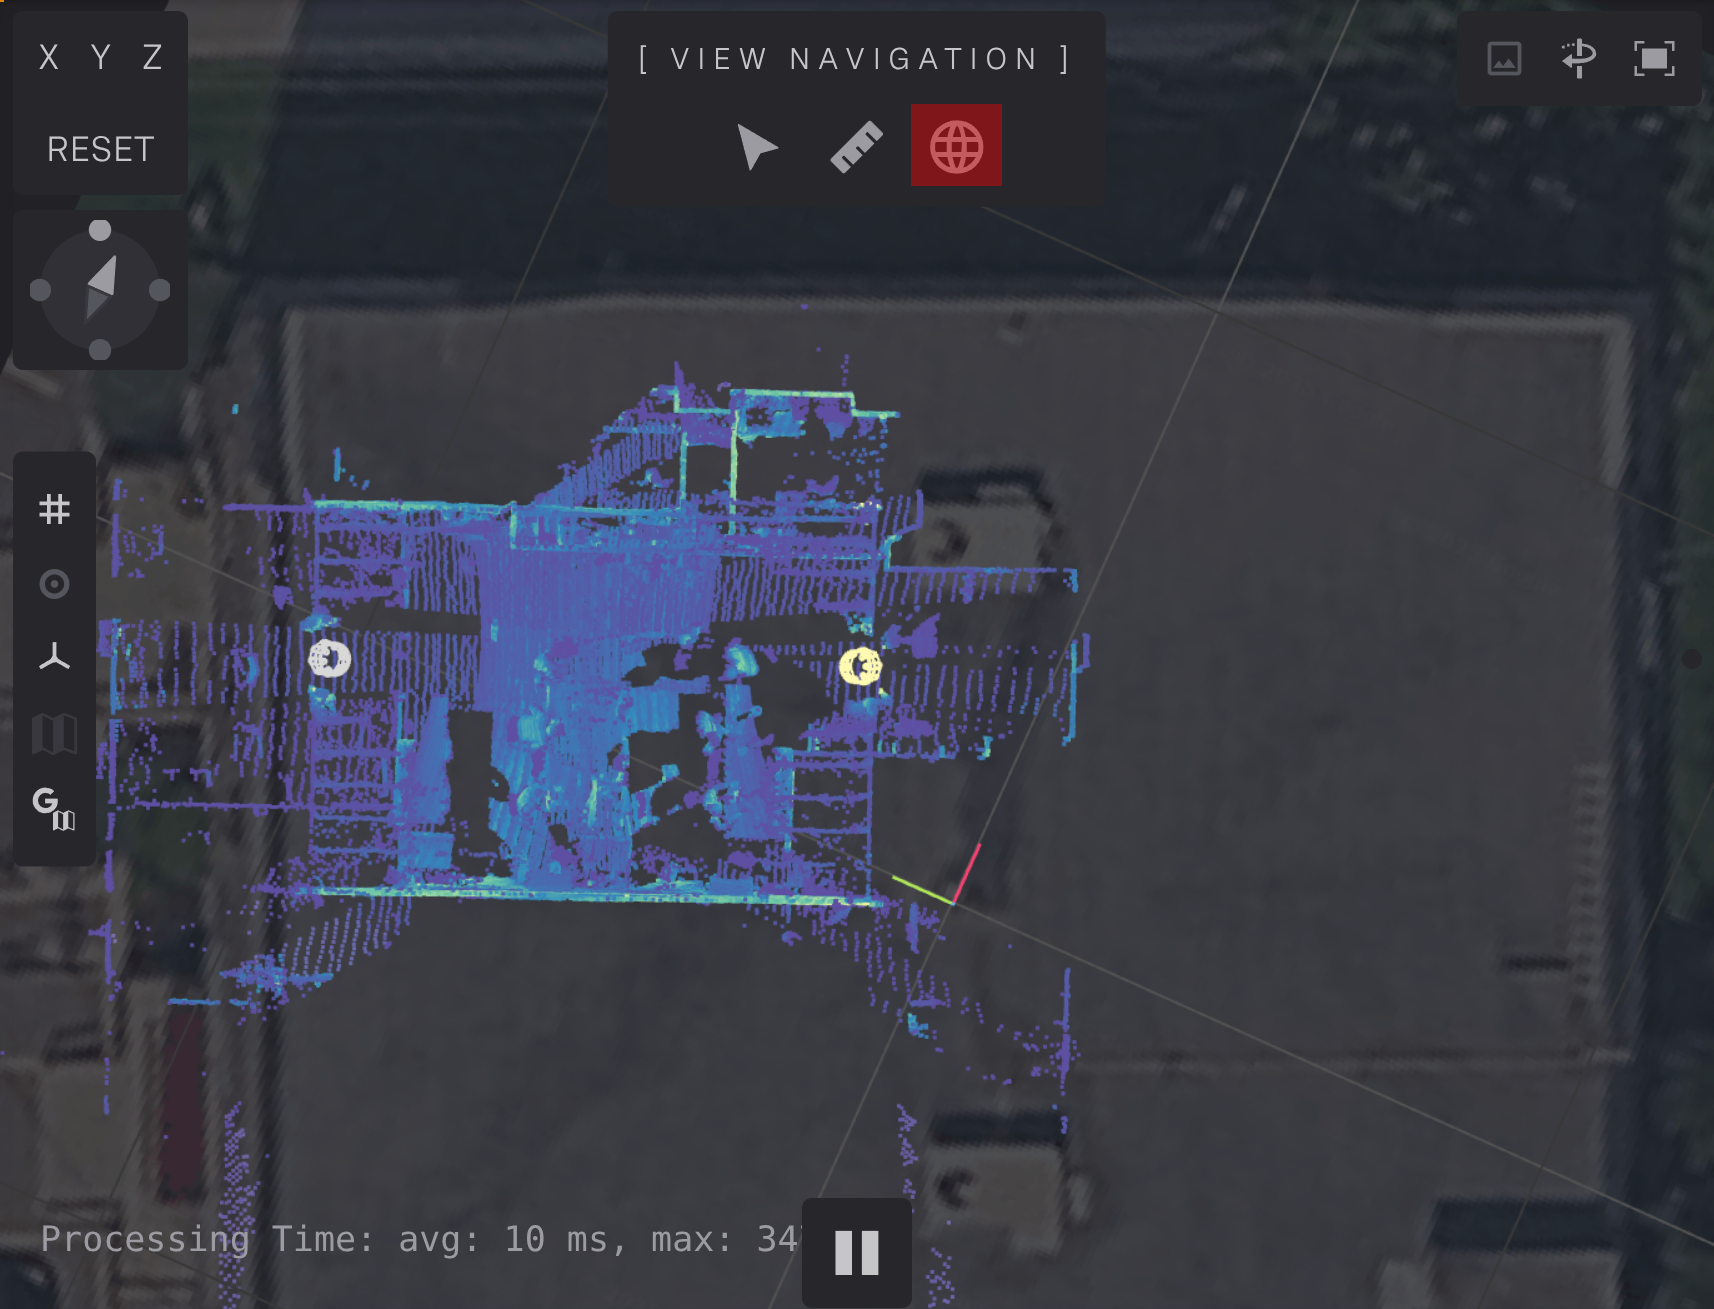
World tool toggle
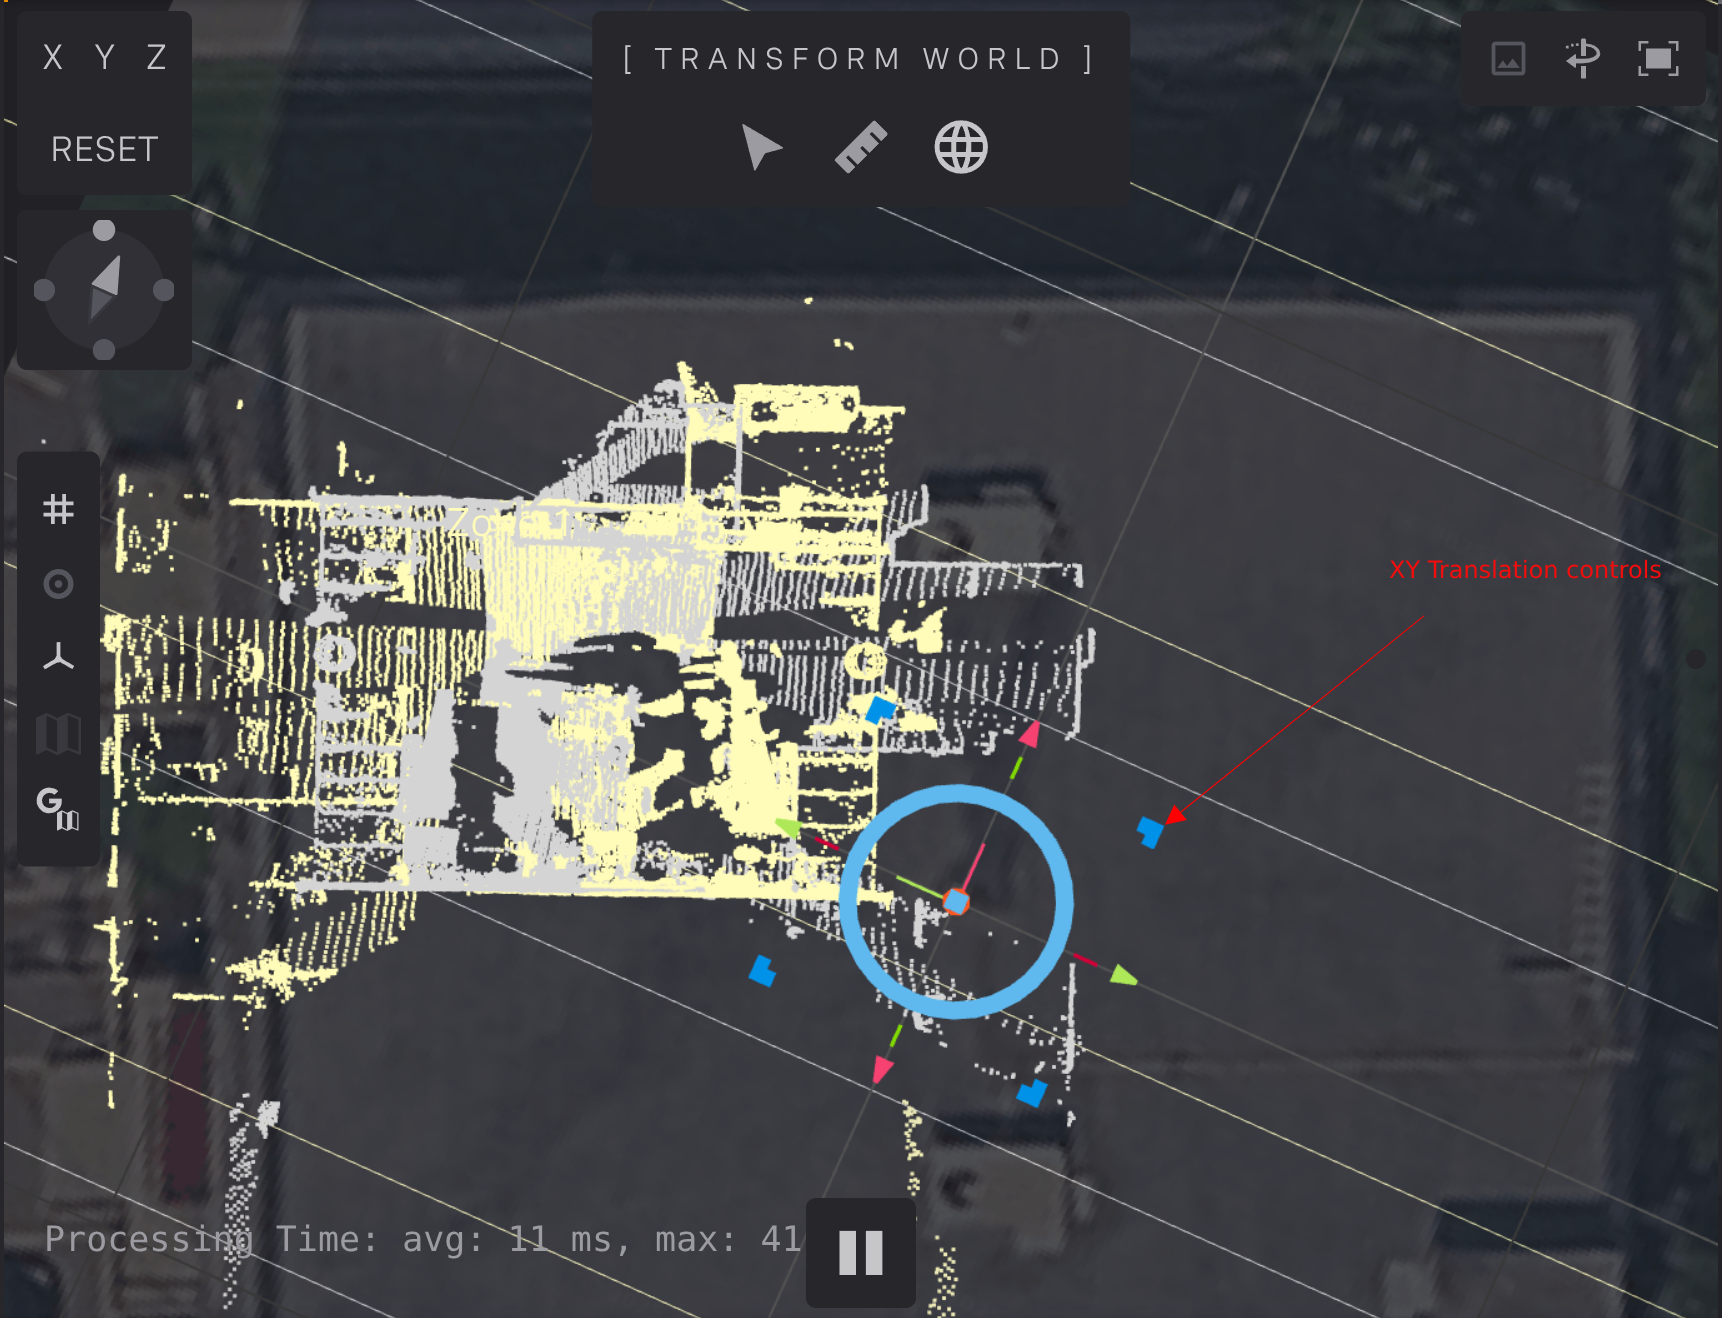
Transform controls once world tool is enabled
You can drag the translation, height, or yaw controls to move all elements with respect to the world reference frame. In the image below, we’ve translated the two sensors and AOD’s to the North-East section of the building.
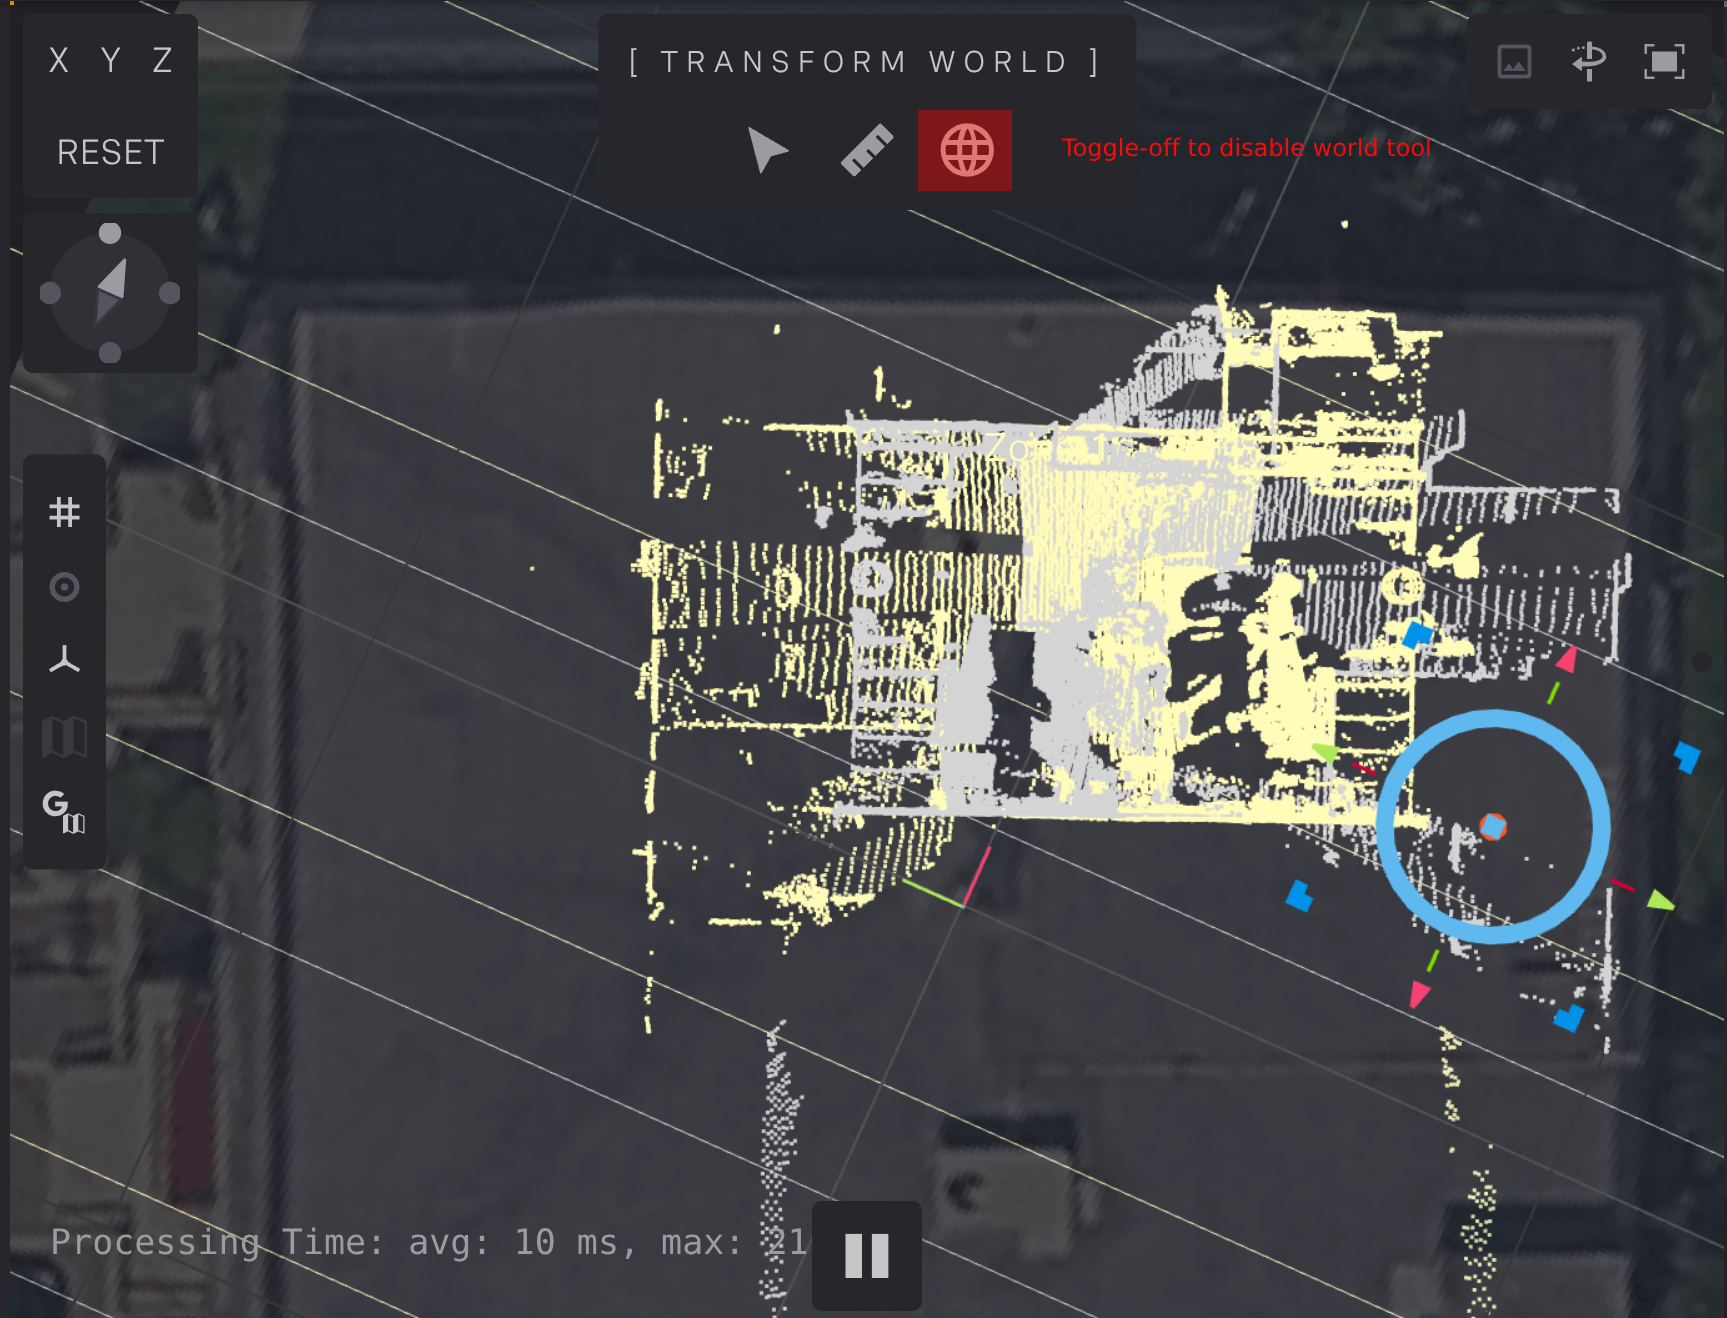
Moved sensors after using the world tool
To exit the world tool, click the globe icon again in the top-center pane.
AODs
Migration Notes
In Detect versions prior to 2.9, Areas of Detection (AODs) were strictly tied to individual sensors. When you upgrade to version 2.9, the system performs an automatic check during the initial startup:
Active Sensors: If an AOD is linked to a live (active) sensor, it will be migrated automatically.
Automatic Naming: Migrated AODs are renamed using the Serial Number (SN) of their original sensor for easy identification.
Cleanup: If a sensor was inactive or could not be verified as active immediately before the upgrade, its associated AOD will be discarded and not migrated.
For new systems where no previous AOD data exists:
The system creates a
default_AODas soon as the first sensor is added.This default is not created if the system detects any migrated AODs from a previous version.
Note
While the migration is automated, we strongly recommend reviewing all AOD settings after the upgrade to ensure the configuration meets your requirements.
Adding an AOD
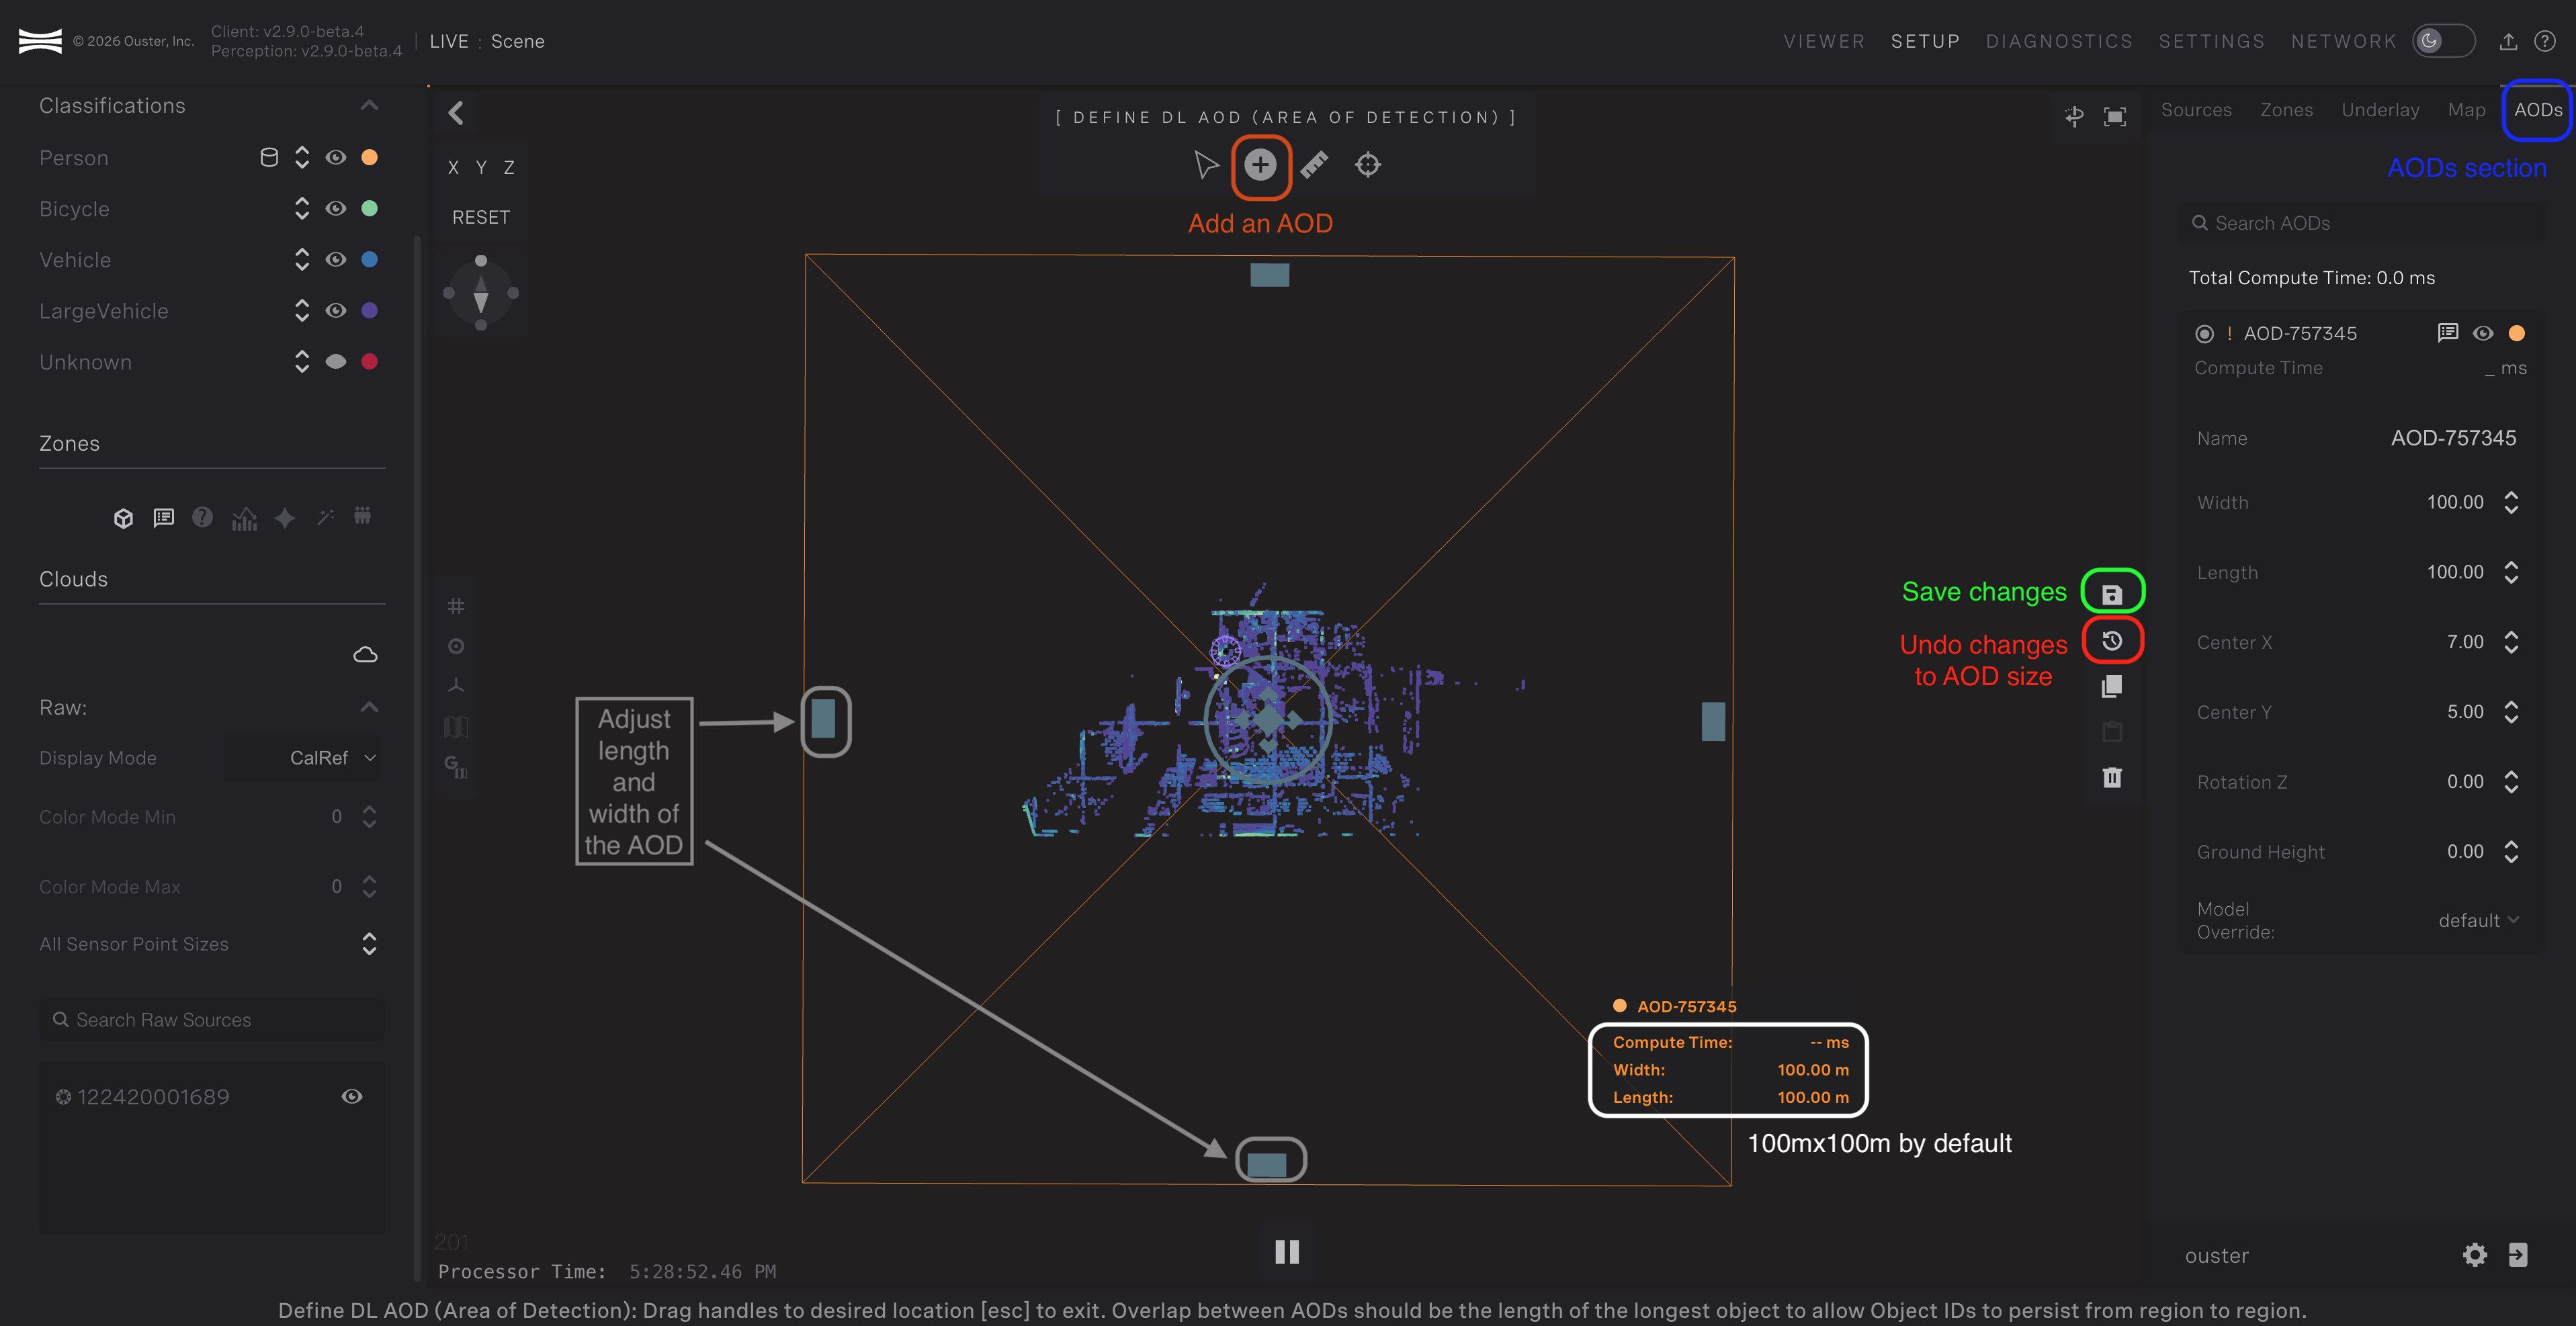
Adding an AOD
To add an AOD, click on the
+icon in the View Navigation menu. The AOD will be placed where you click with your mouse. By default an AOD of length and width 100m by 100m will be placed.Use the transform controls to adjust the length/width, rotation around z-axis, and position of the AOD.
Click the Undo button to revert any edits. Click the save icon to save changes to Detect
Editing an AOD
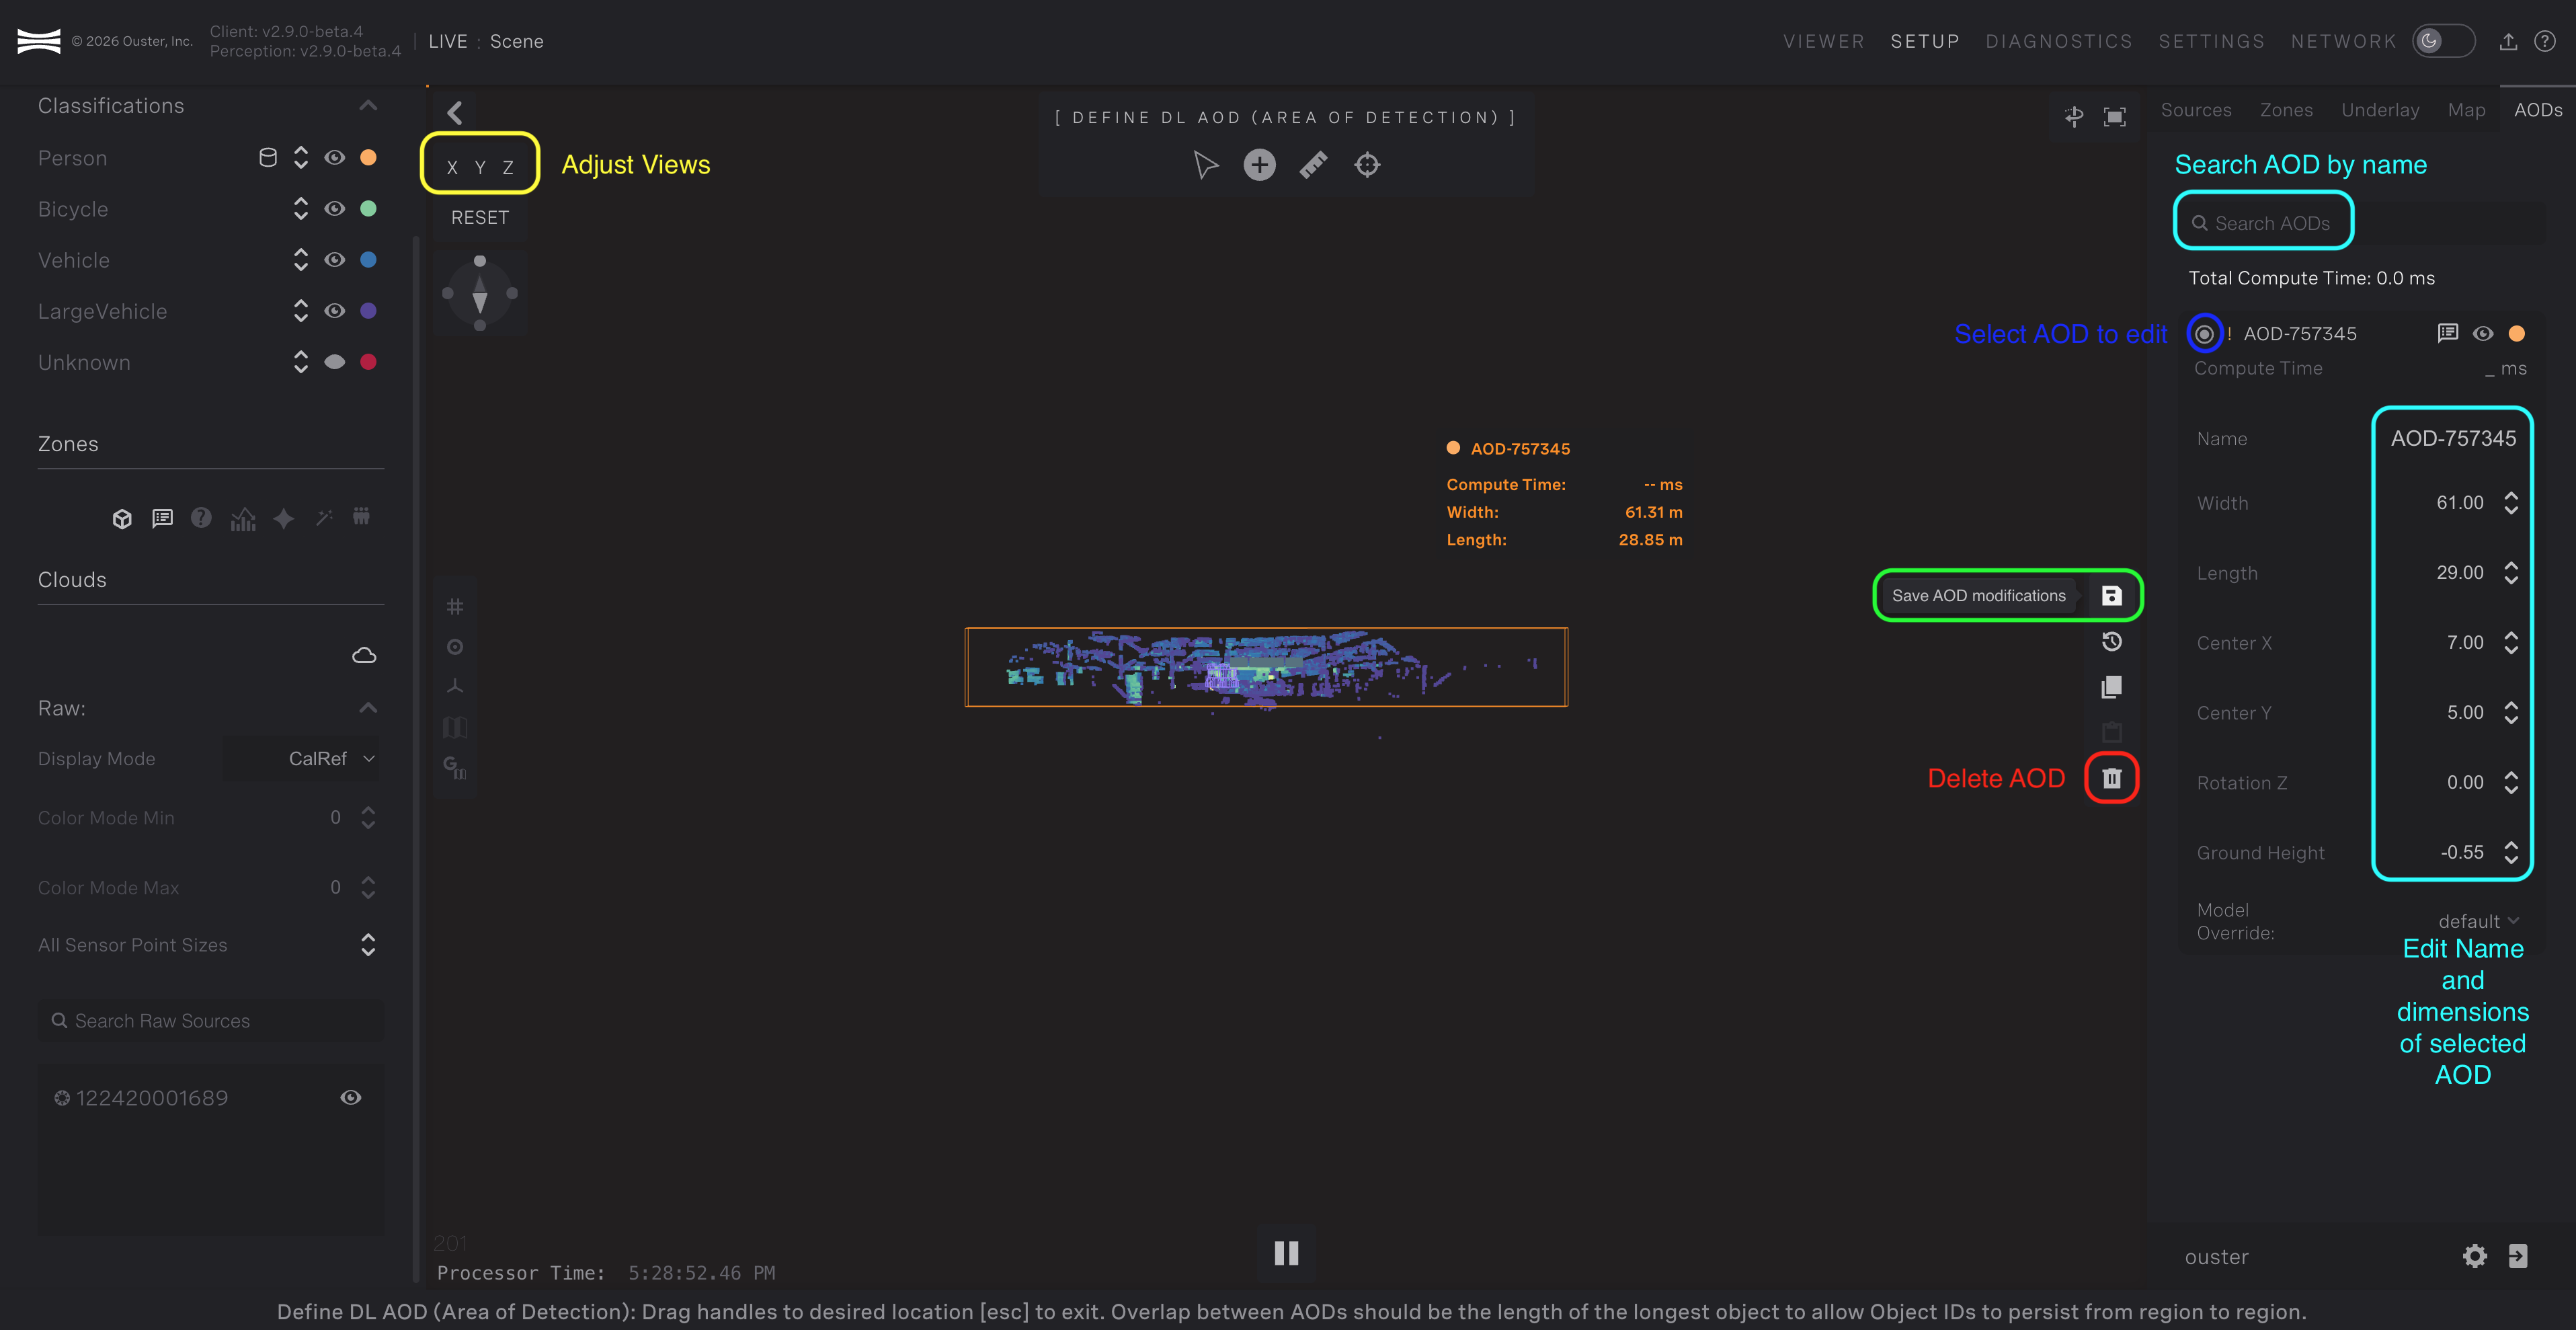
Editing an AOD
AOD’s can be filtered by name using the Search bar on the right-side panel.
Click on an AOD in the right-side bar to edit.
All controls can be made with the properties panel on the right-side. To edit using the properties panel, click on the values to directly type in or use the arrow keys to adjust with the mouse.
Adjust the length/width, rotation, and position from a top-down view with the transform controls.
To adjust the height, use the height controls in the right pane.
Use the Save icon to save changes to Detect.
To delete an AOD, select the AOD on the right pane and click on the delete icon.
Compute Time of AODs
The compute time is displayed for each AOD in the scene. This helps the user understand if the AOD is too large and indicates to them if they need to re-adjust. Along with the compute time per AOD, the total compute time is also displayed.
After saving an AOD in Detect, the compute time will take about 10 seconds to re-adjust and settle to a stable state. If the compute time for an AOD is over 100ms, a warning icon is displayed indicating the AOD needs to be reduced in size.
Zones
Zones can be configured and viewed throughout the GUI. To access the zone editing page, select Setup > Zones.
The tool icons at the top of the 3D viewer provide editing and creation options for zones in the scene. Different tool and panes are numbered in red. They are as follows:
Tool to
select new zones. The user can then use the mouse to click on and select a specific zone.Tool to
create a new Event. The user can then create either anInclusionor anExclusionzone.Tool to
enable the zone editing. Requires a zone to be pre-selected. You can move zone vertices around with the tool.Tool to enable the
Add/Remove Vertexfeature. Requires a zone to be pre-selected.Lists all the
event zones. Zones can be selected through this pane.Lists all
point zones. Zones can be selected through this pane.Panefor editing properties of specific zones. Also included in this pane is the ability to save, delete and copy zones.
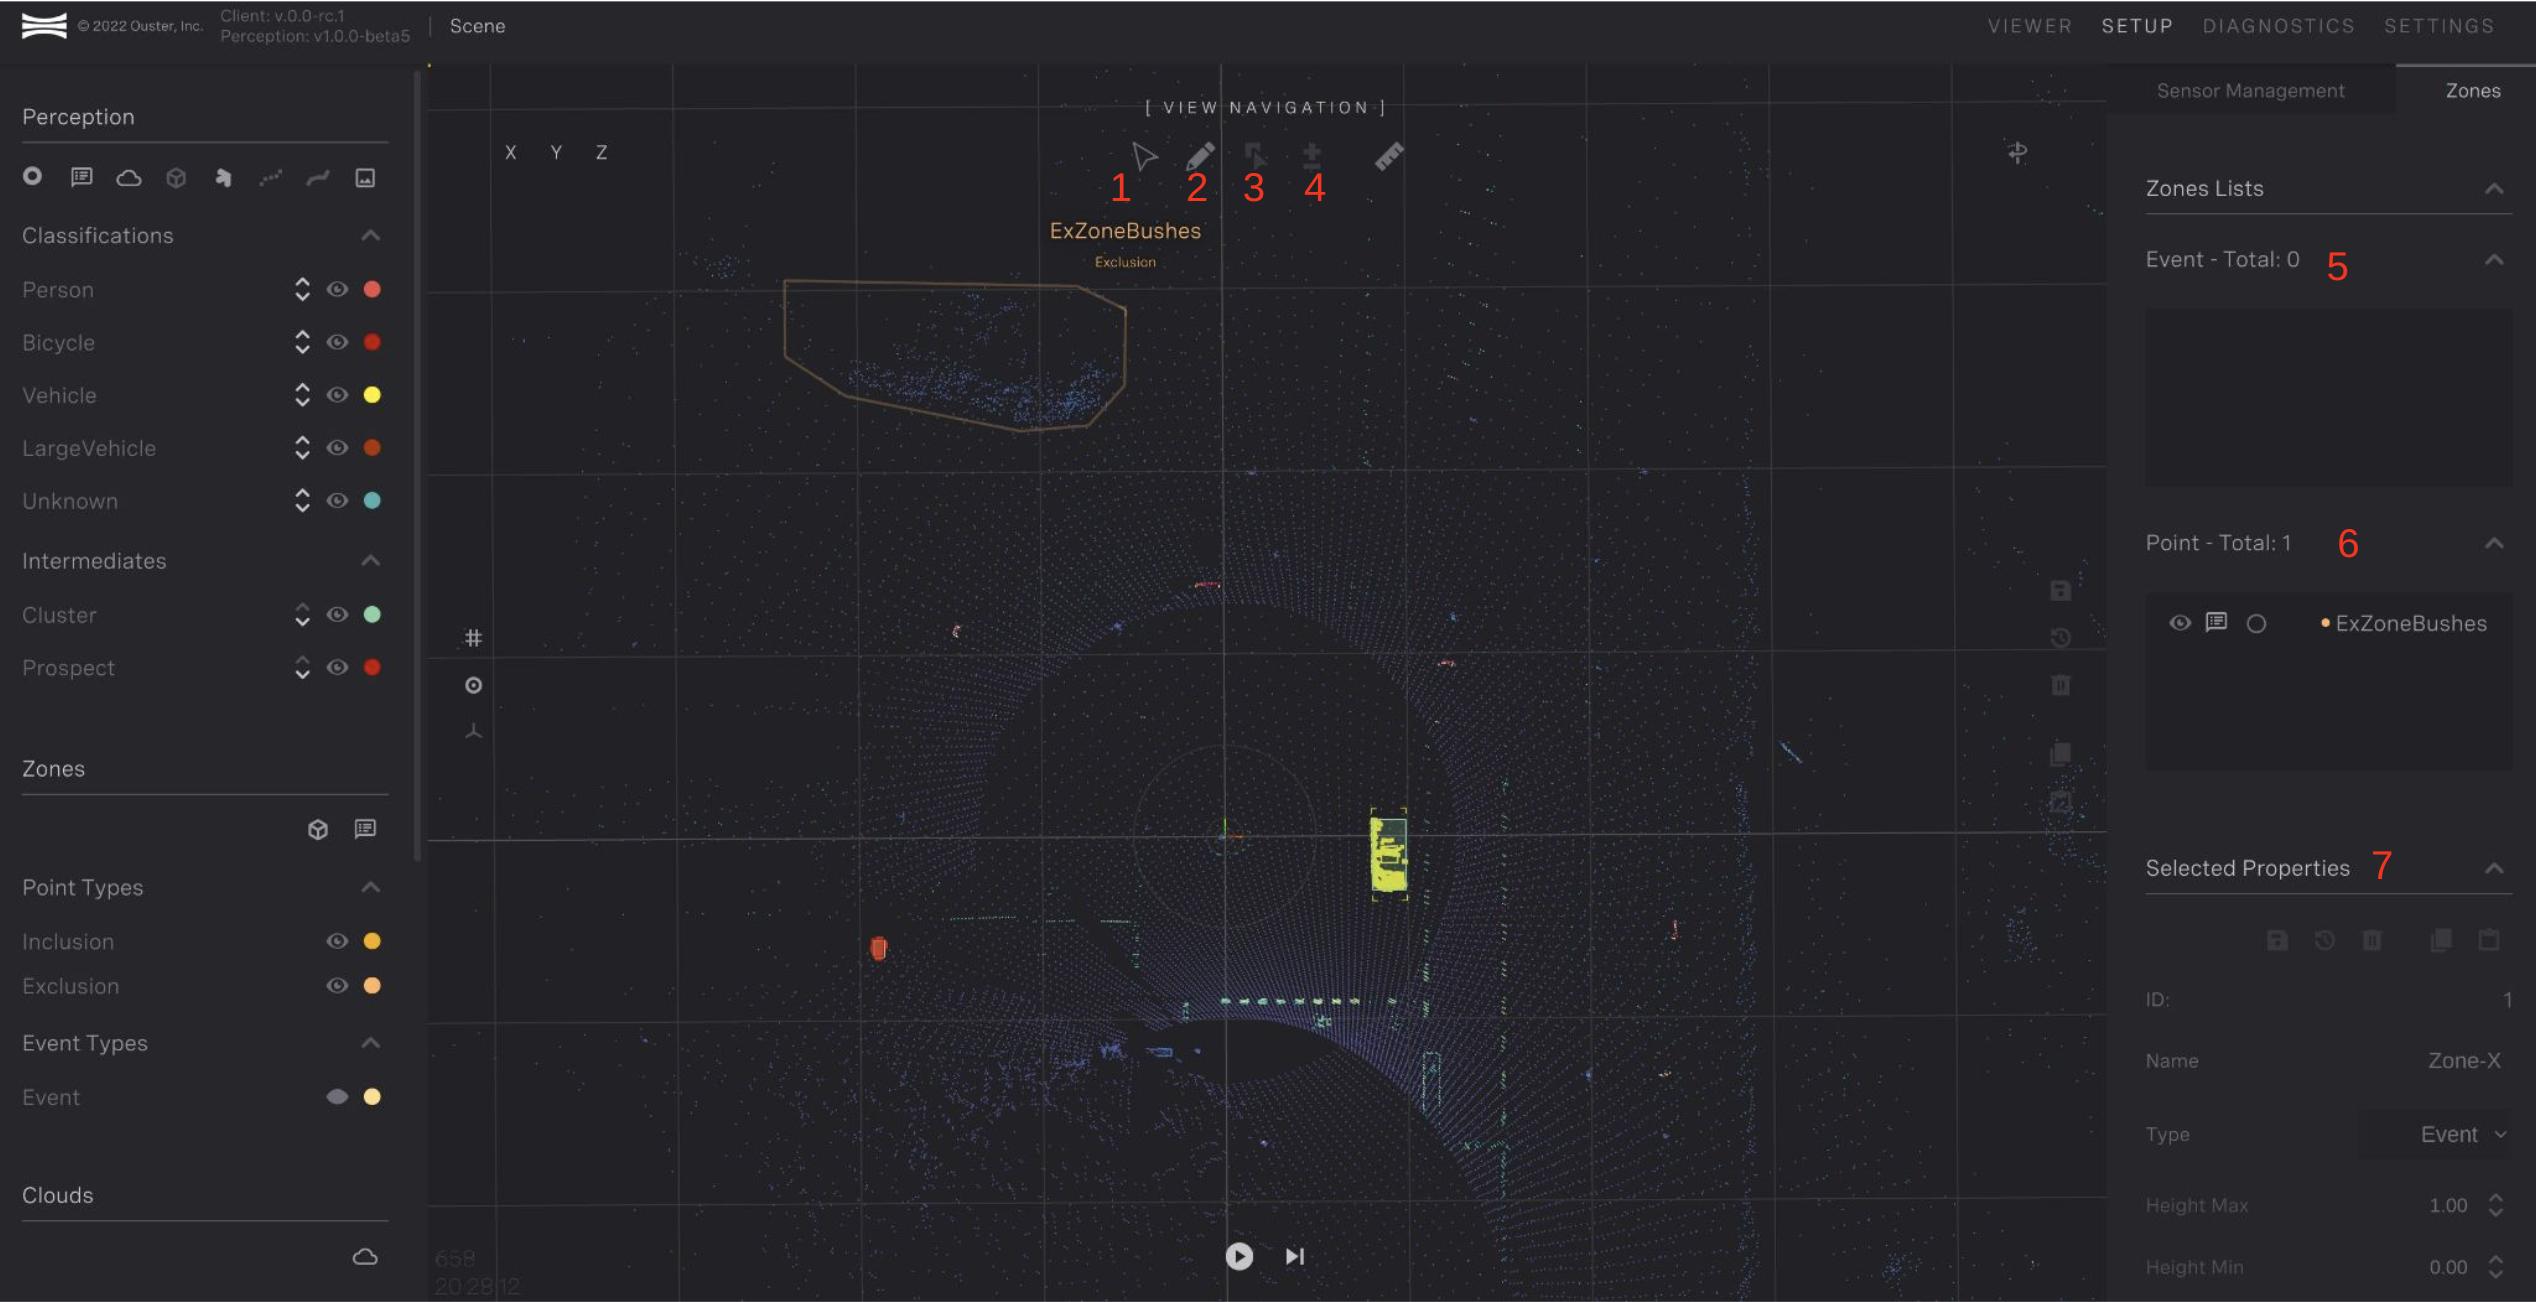
Zone configuration page
Zone Workflow
A typical workflow for zones creation occurs after the sensors have been setup. Steps are:
Identify if there are areas that are not required for object tracking. This can include vegetation or areas where there are objects not of interest. Both exclusion and inclusion zones can be used to set this up. Exclusion zones takes priority, and nothing will be detected inside an exclusion zone. Inclusion zones can be used to pick specific areas of interest. Note that if there are any inclusion zones then only points in inclusion zones will be included.
Draw the zones based on your analysis from a top down view. Edit the zone min and max height in the properties pane. Name them appropriately for situational awareness.
Create event zones based on areas where you want specific notification of objects. Set a descriptive name.
Make any modification to the zones as required based on tracked objects.
Configure the zone metadata field as required for specific use cases. Refer to Zone Metadata.
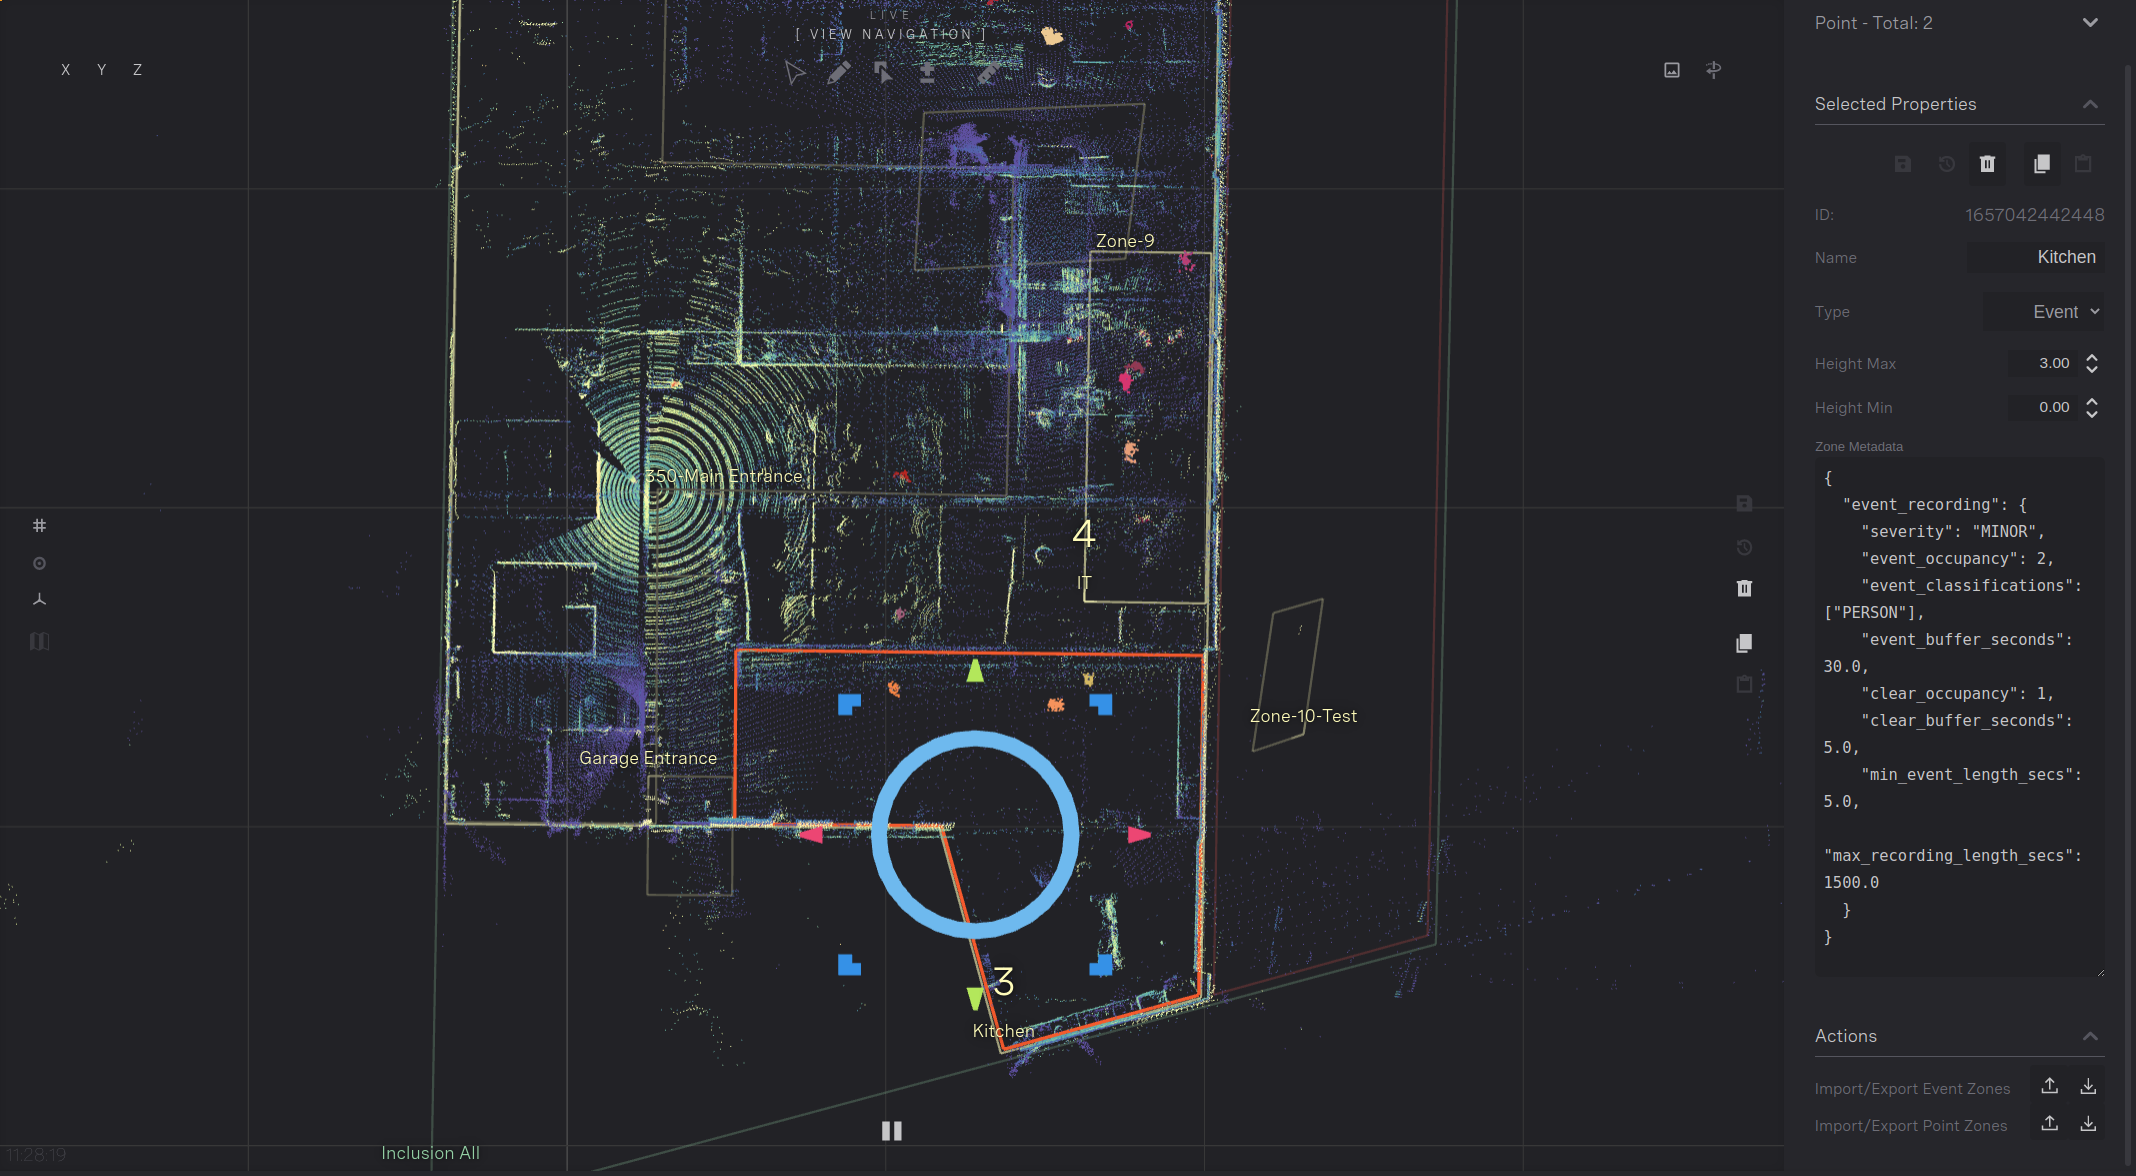
Zone Metadata
Point Zone Customization
Point zones can be customized to only apply to specific sensors. This may be required if there are areas with reflection or noise from a sensor that should not be excluded from other sensors.
Example to configure a point zone:
{
    "sensor_filter": [
        "122334001459"
    ]
}
Field |
Definition |
Valid Values |
|---|---|---|
Sensor IDs |
Sensors to apply the filter to |
Array of sensors IDs |
Zone Event Recorder
Example to setup an event zone:
{
  "event_recording": [
    {
      "severity": "MINOR",
      "event_occupancy": 1,
      "event_classifications": [
          "PERSON"
      ],
      "event_sub_classifications": [
          "pedestrian"
      ],
      "event_buffer_seconds": 30,
      "clear_occupancy": 0,
      "clear_buffer_seconds": 5,
      "event_trail_seconds": 10,
      "min_event_length_secs": 1,
      "max_recording_length_secs": 60
    },
    {
      "severity": "MAJOR",
      "is_point_count": true,
      "event_occupancy": 1250,
      "event_buffer_seconds": 30,
      "clear_occupancy": 100,
      "clear_buffer_seconds": 5,
      "event_trail_seconds": 10,
      "min_event_length_secs": 2.5,
      "max_recording_length_secs": 60,
      "reset_on_timeout": true
    }
  ]
}
Field |
Type |
Description |
|---|---|---|
|
|
Array of Event Recording configurations. The first configuration that evaluates true will trigger an Event Recording. In the event of a tie, the configurations will be prioritized in the order listed.` |
|
|
Severity of the event ( |
|
|
Minimum occupancy/point count of the zone to trigger the event (greater than or equal) |
|
|
Optional list of object classifications to consider (default = [ |
|
|
Optional list of object sub-classifications to consider (default = []). The object must also satisfy one of the object classification criteria. |
|
|
Optional time in seconds to include in the recording prior to event triggering up |
|
|
Occupancy/Point Count of the zone to clear the event (less than or equal) |
|
|
How long in seconds the zone occupancy/point count needs to be below “clear_occupancy” before the event is cleared (greater than) |
|
|
Optional time in seconds to include in the recording following the event clearing. This time is inclusive of “clear_buffer_seconds”. |
|
|
How long in seconds the zone occupancy/point count needs to be above “event_occupancy” before the event is triggered (greater than or equal) |
|
|
Maximum length of the recording in seconds (less than or equal). This time is exclusive of “event_buffer_seconds”. |
|
|
Optional indicator if occupancy is based on the Event Zone point count (default = false) |
|
|
Optional indicator if the event will automatically re-trigger after a timeout. If set to false, the event must clear before a new event will be triggered (default = false) |
Zone Alert
Example:
"{
  "alert": {
    "severity": "WARNING",
    "occupancy": 1,
    "minimum_dwell_seconds": 1,
    "classifications": ["PERSON", "BICYCLE"],
    "message": "Zone is not empty"
  }
}"
Field |
Definition |
Valid Values |
|---|---|---|
severity |
Severity of the event |
|
occupancy |
Minimum occupancy of the zone to trigger the alert |
|
minimum_dwell_seconds |
How long the zone occupancy needs to be above [occupancy] before the alert is set (in seconds) |
|
classifications |
Object classifications to consider (comma delimited) |
|
message |
Message associated with the alert |
Message displayed in the Detect Viewer |
Zone Filters
Zone filters can be applied to limit the triggering of zones in the Viewer only. These do not affect the output streams of Detect (e.g., TCP, WebSocket, MQTT).
Example:
{
    "include_classifications": [
      "PROSPECT",
      "UNKNOWN",
      "PERSON",
      "VEHICLE",
      "BICYCLE",
      "LARGE_VEHICLE"
    ]
}
Field |
Definition |
Valid Values |
|---|---|---|
|
Objects meeting these filter conditions will not trigger zones in the Viewer only. These do not affect the output streams of Detect (e.g., TCP, WebSocket, MQTT). |
|
Point Count Zones
Ouster Gemini Detect supports counting the lidar returns in an event zone and reporting statistics about the x, y, and z values ranges within the zone. The statistics reported for all x, y, and z value are the following:
The minimum value of all points within the zone
The minimum value of all points within the zone after removing the lower-percentile of points
The median value of all points within the zone
The maximum value of all points within the zone after removing the upper-percentile of points
The maximum value of all points within the zone
This information is sent through the occupation stream when enabled. To enable this functionality while editing a zone, under Selected Properties in the right side-bar, select Count Points. You can also configure the Lower Percentile and Upper Percentile which will alter how many points will be removed when finding the minimum and maximum defined in #2 and #4 above, respectively.
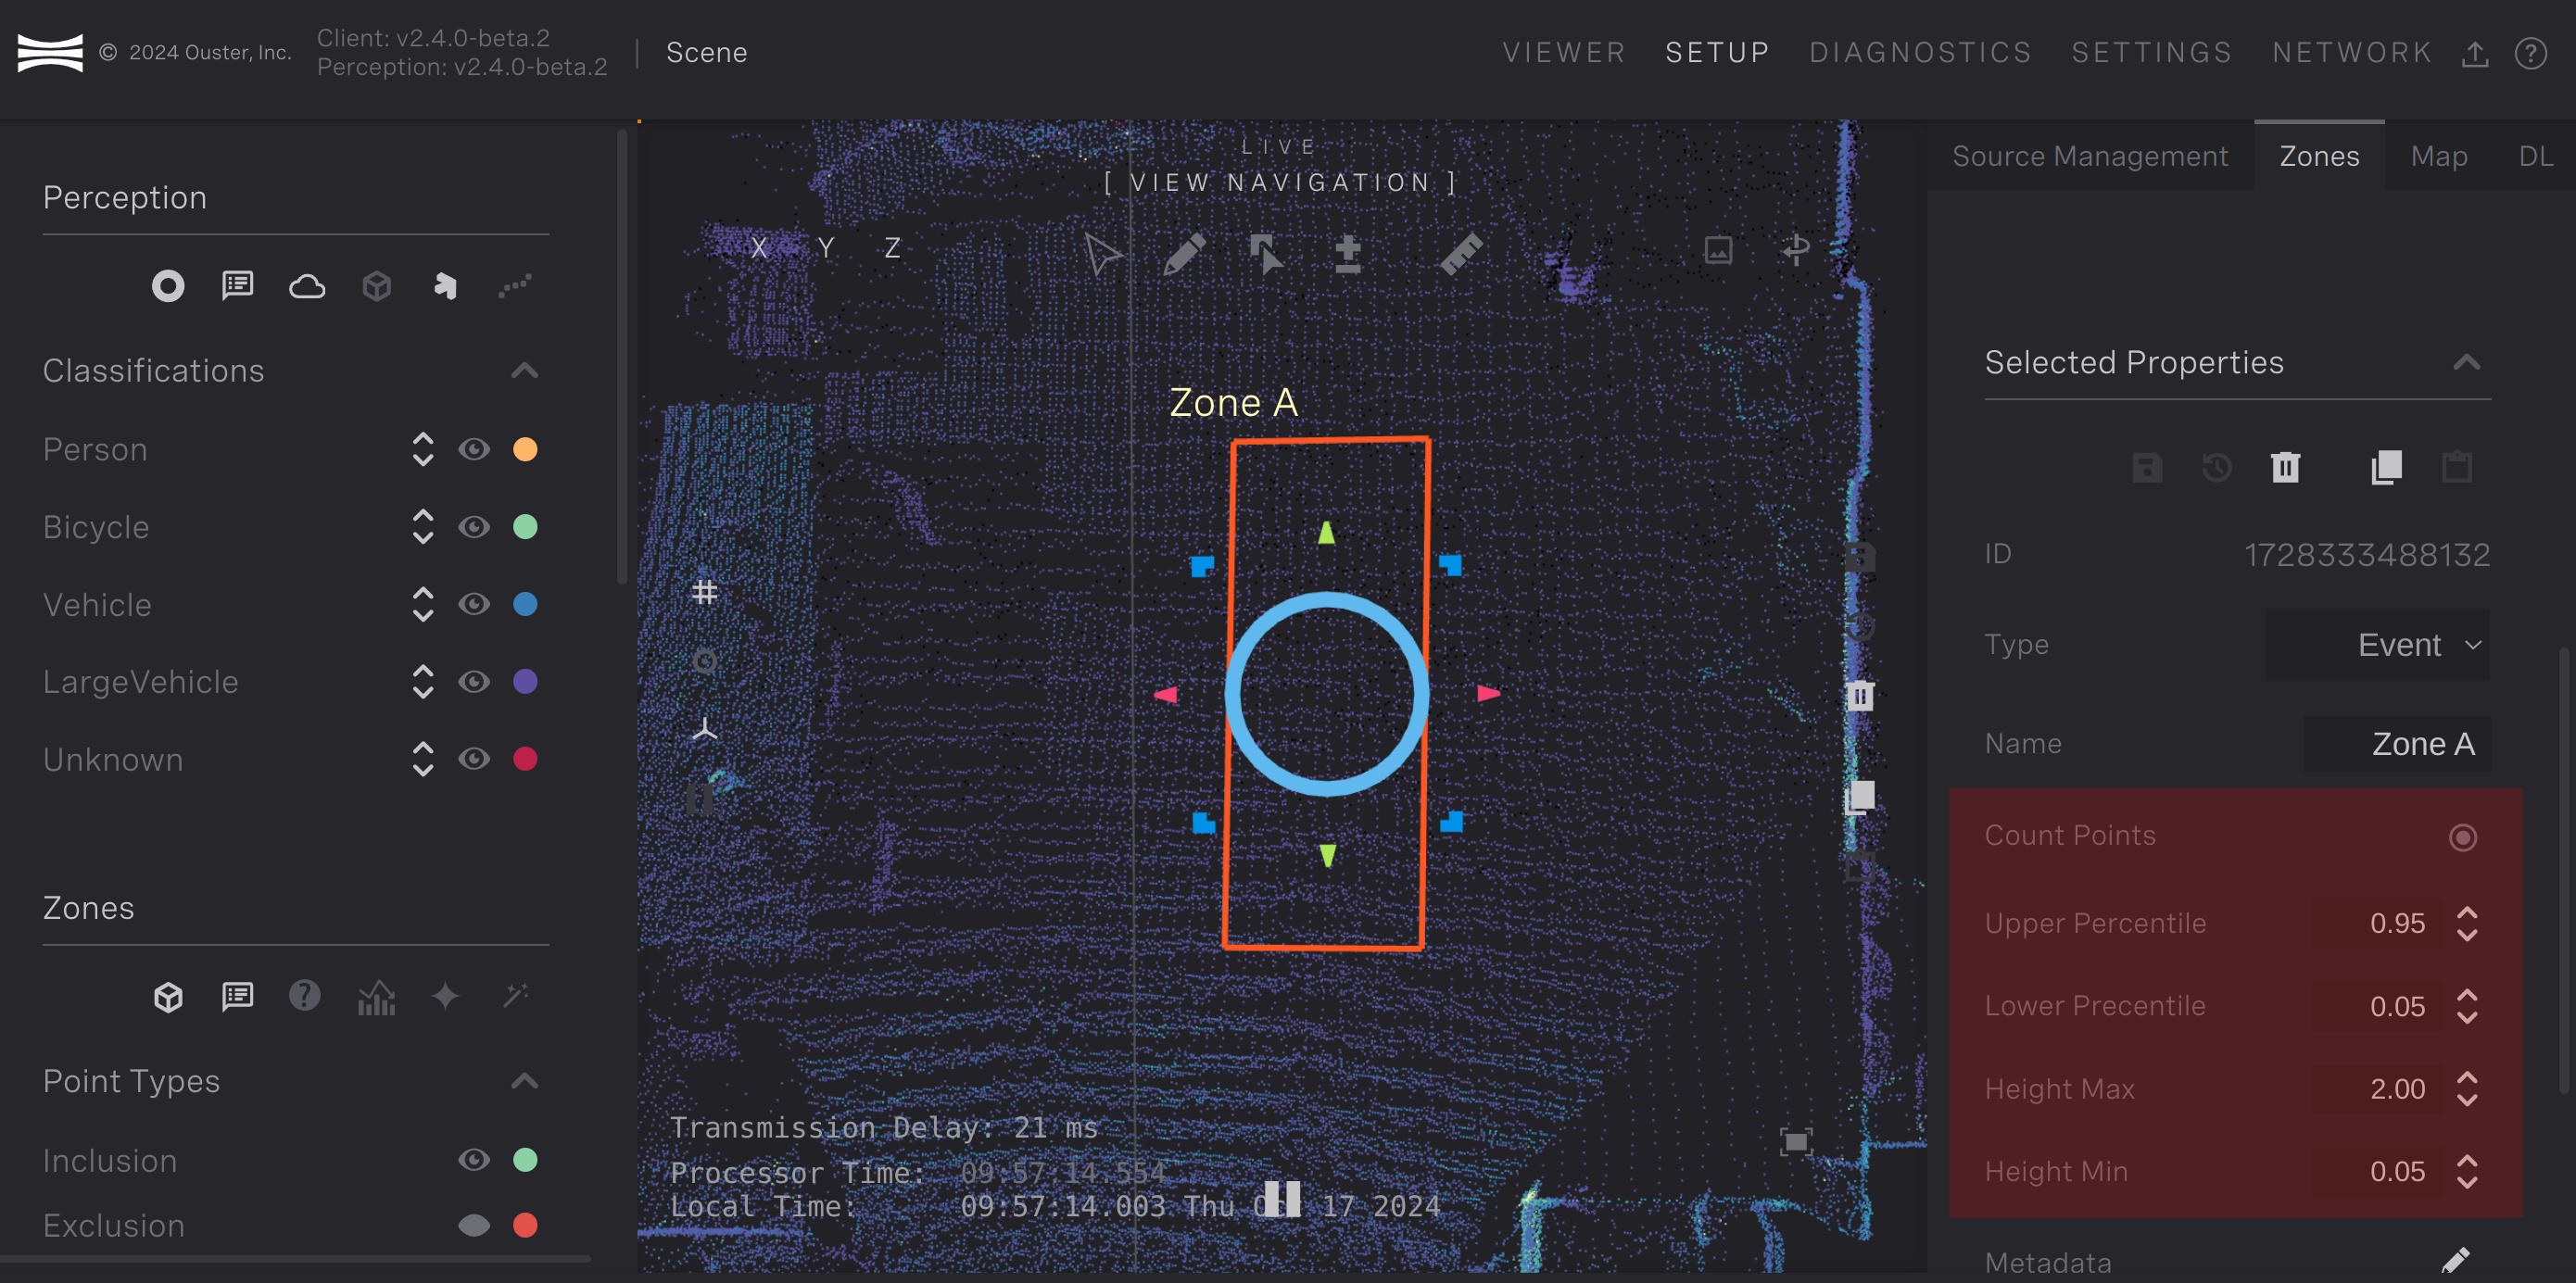
Configure point counting
Save the zone for the changes to take effect. See :ref:occupations-data for information about parsing this information from the occupations stream.
You can view the point count output for each zone on the Viewer page. When lidar returns are within the zone, the zone will highlight the number of points within the zone with the other zone information. In the image below, you can see a person with 1969 lidar returns on them.
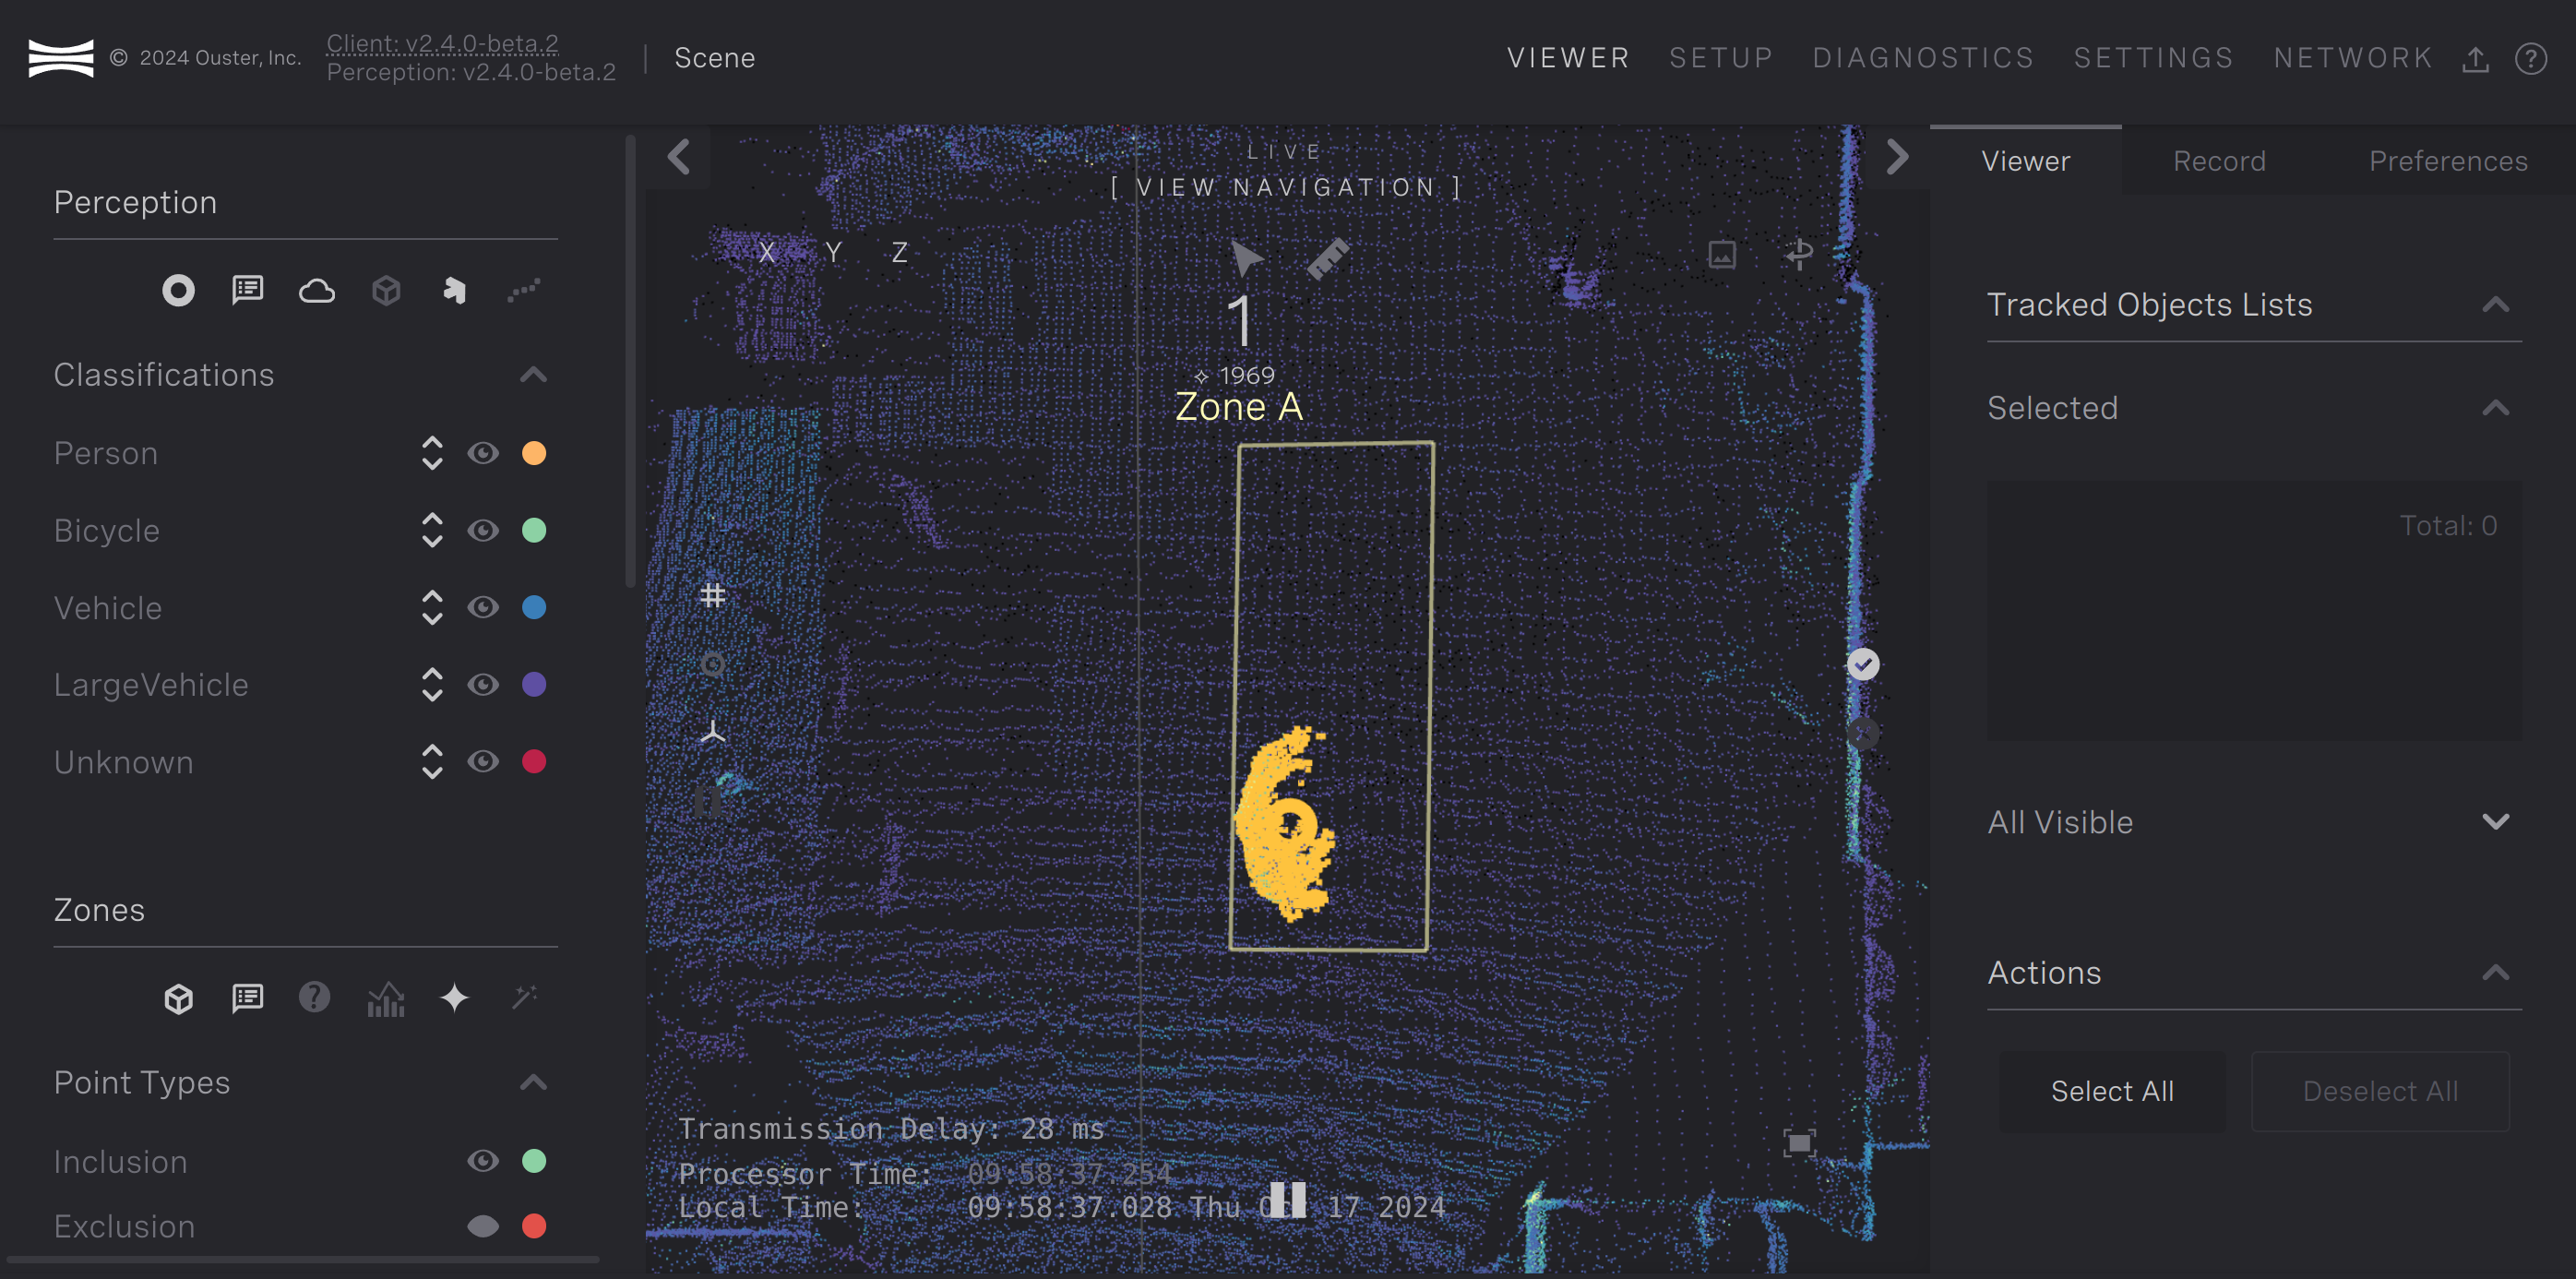
Person with 1969 points on them in Zone A
You can see additional point statistics on the points in the zone by clicking the histogram icon on the left side-bar on the Viewer page.
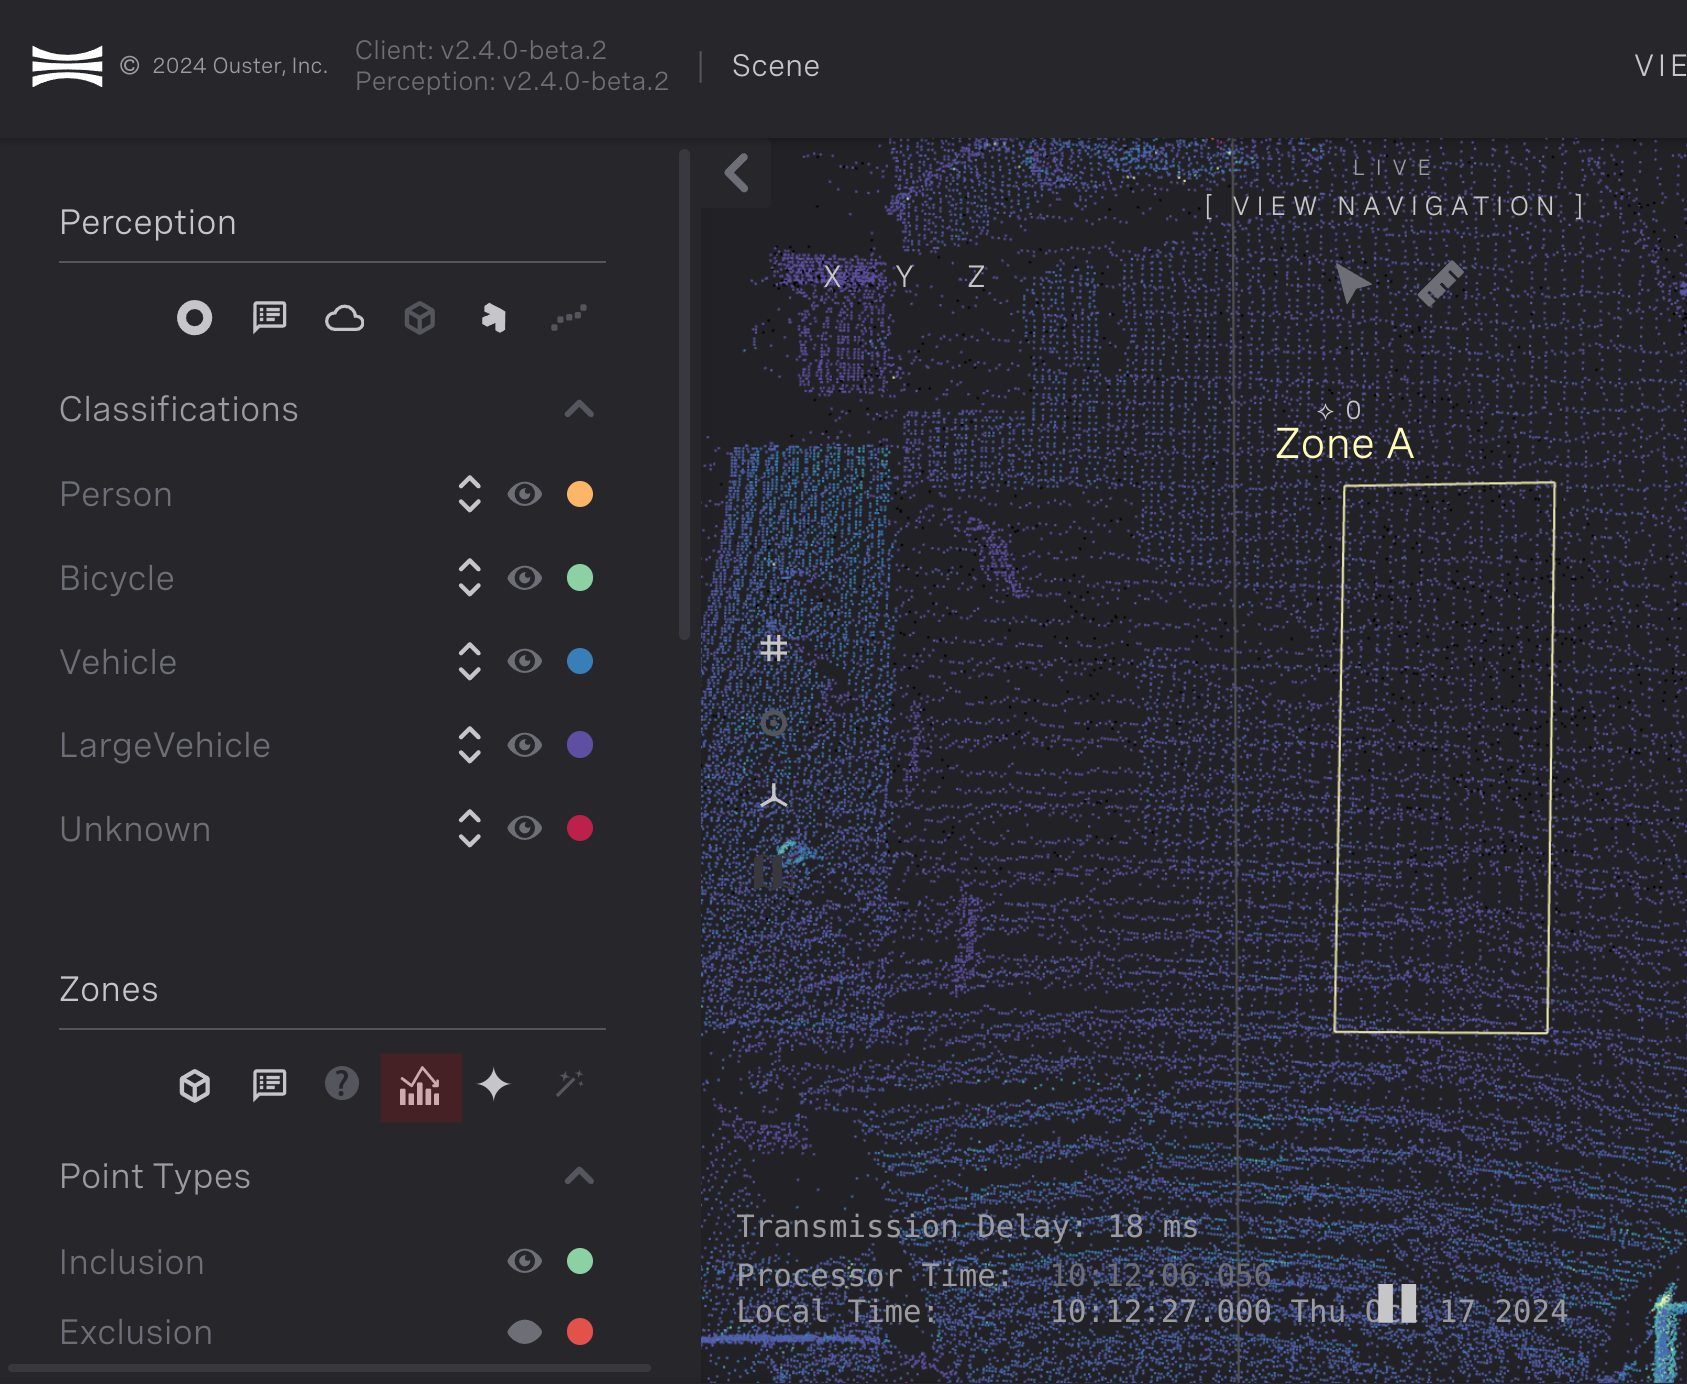
Toggle for additional point statistics
When additional point statistics are selected the zone information display will expand to show the min and max statistics listed above for the x, y, and z values in the zone.
Note
The additional statistics will only be displayed when there are more than 10 points within the zone regardless of the additional point statistics being selected. The figure below shows how the additional point statistics are displayed.
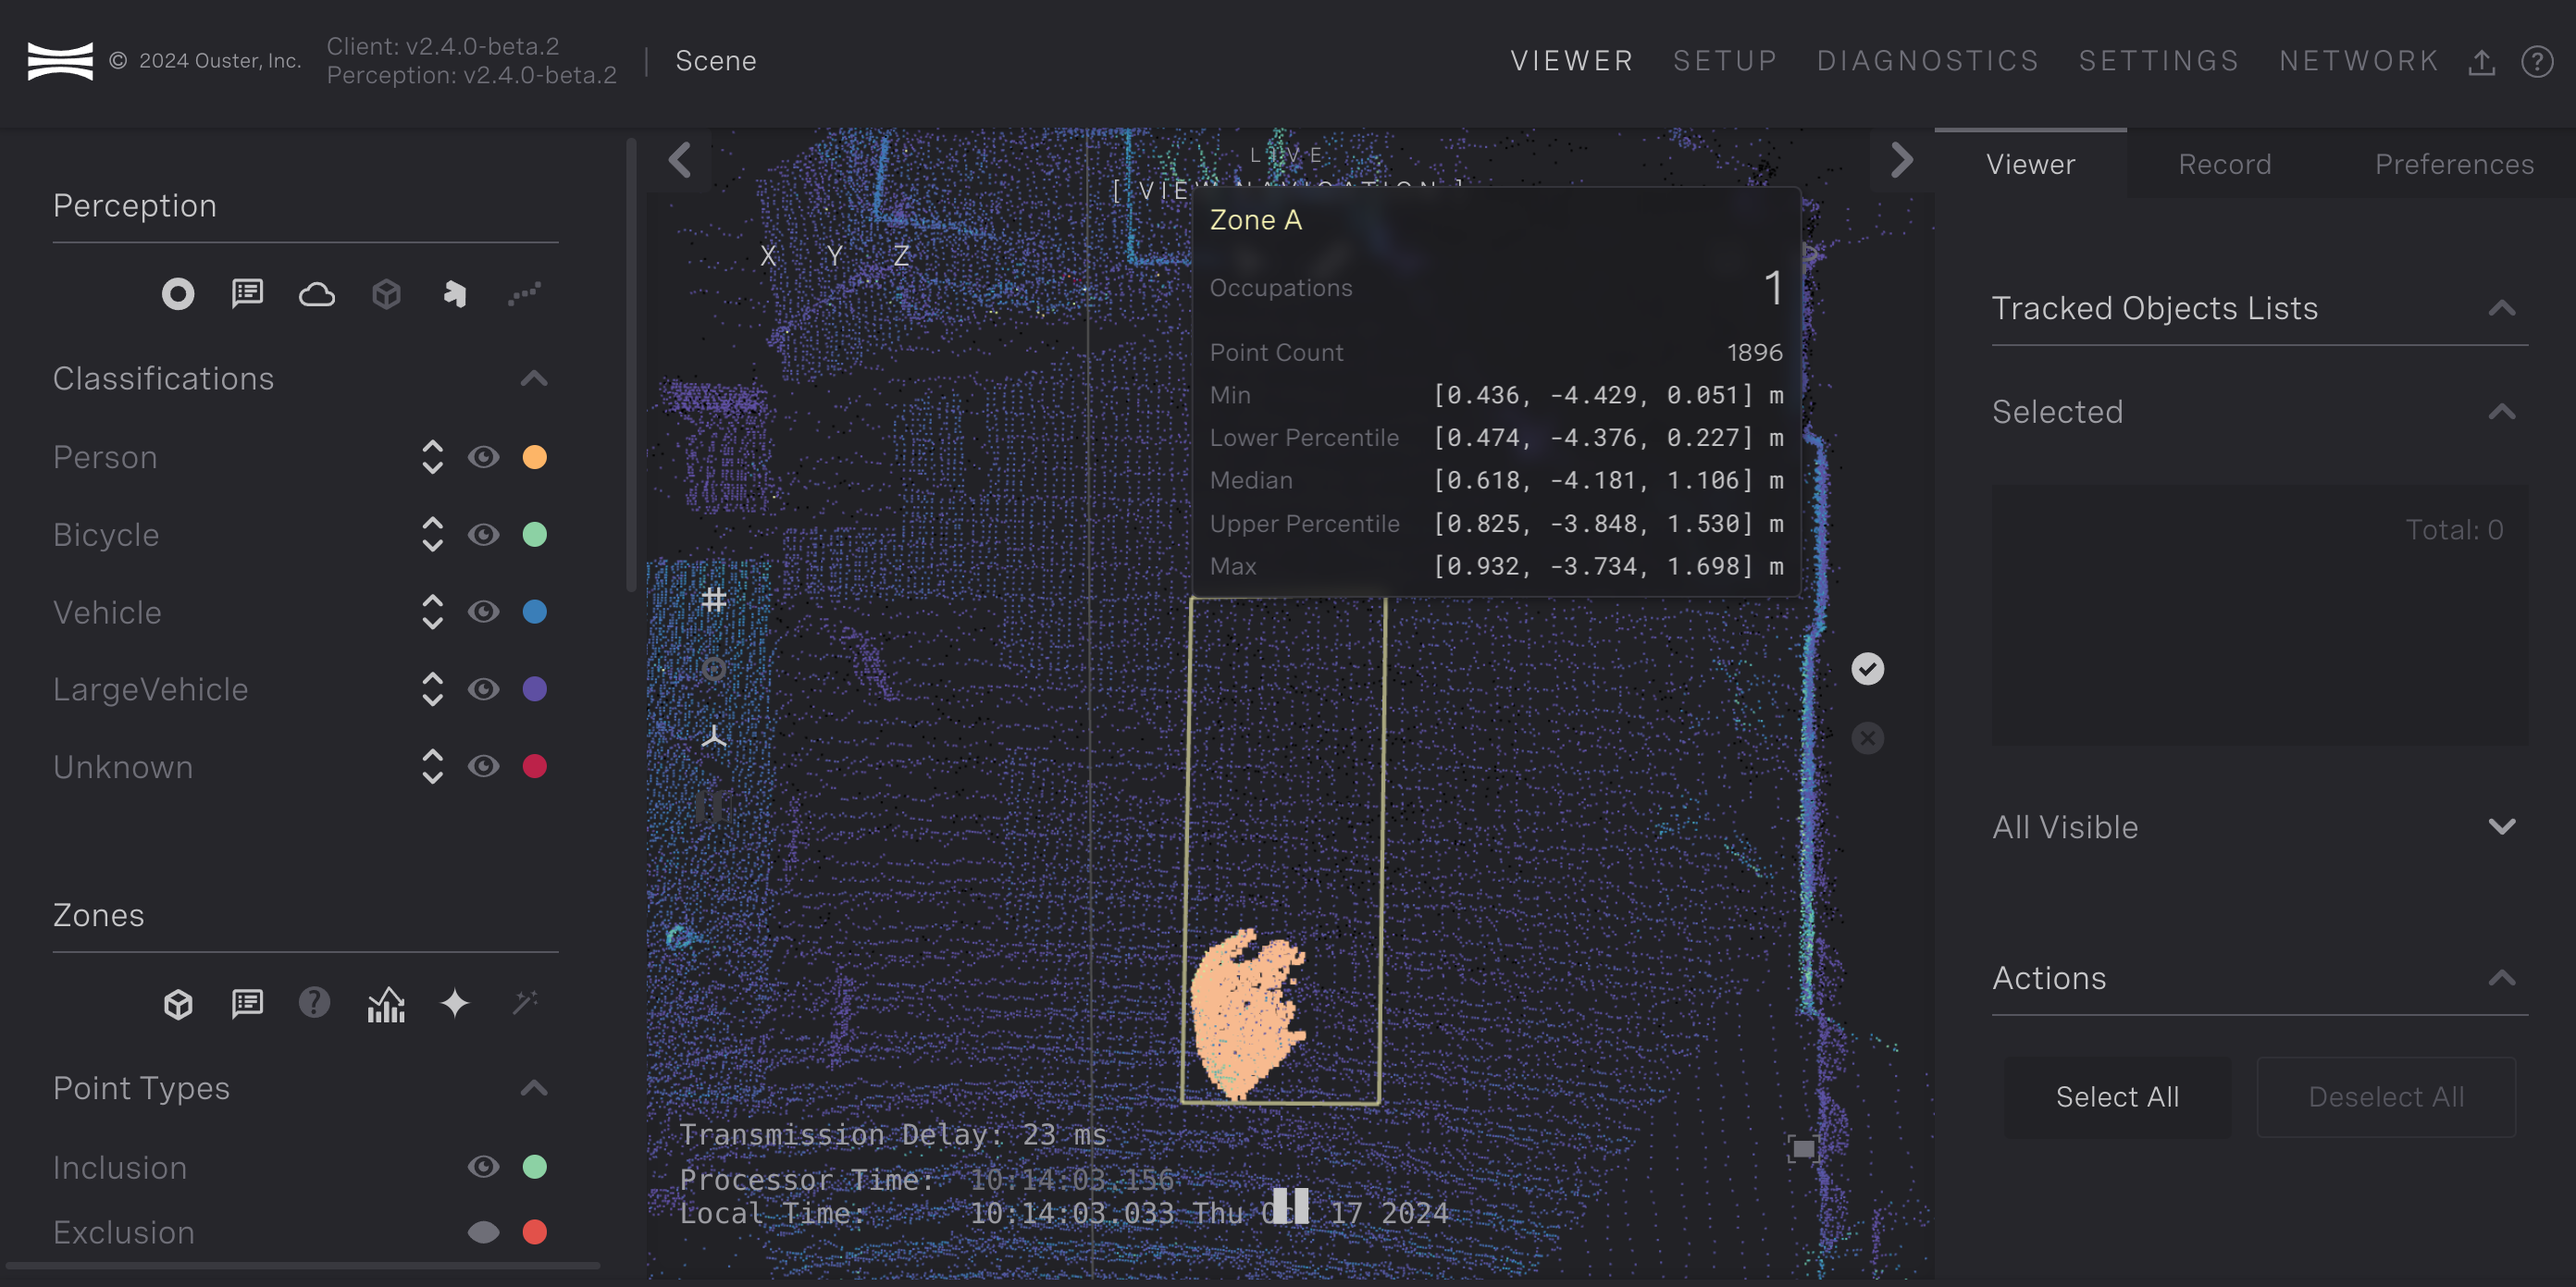
Additional point statistics for person in Zone A
DIAGNOSTICS
Diagnostics
Ouster Gemini Detect system and Ouster sensor diagnostics can be seen in the GUI Diagnostics tab. Details of the various Ouster sensor alerts can be found in the Ouster Firmware User Manual. Ouster Gemini Detect system alerts are documented in the Alert Data (ref to alert data section) section.
The Diagnostics alert table view can be filtered by status, alert code and alert level. System and Sensors sections can be collapsed to focus on specific alerts. Each alert can be expanded with further details.
The Diagnostics tab offers access to log files, configuration files and API testing tools (Swagger UI). Logs and configuration files can be downloaded for further investigation. Swagger UI webpages can be used as documentation of Ouster Gemini Detect APIs as well as a test platform to issue commands to running Ouster Gemini Detect components.
SETTINGS
Settings
Ouster Gemini Detect’s processing settings can be changed on the settings page. When the settings page is accessed current settings are fetched from the server.
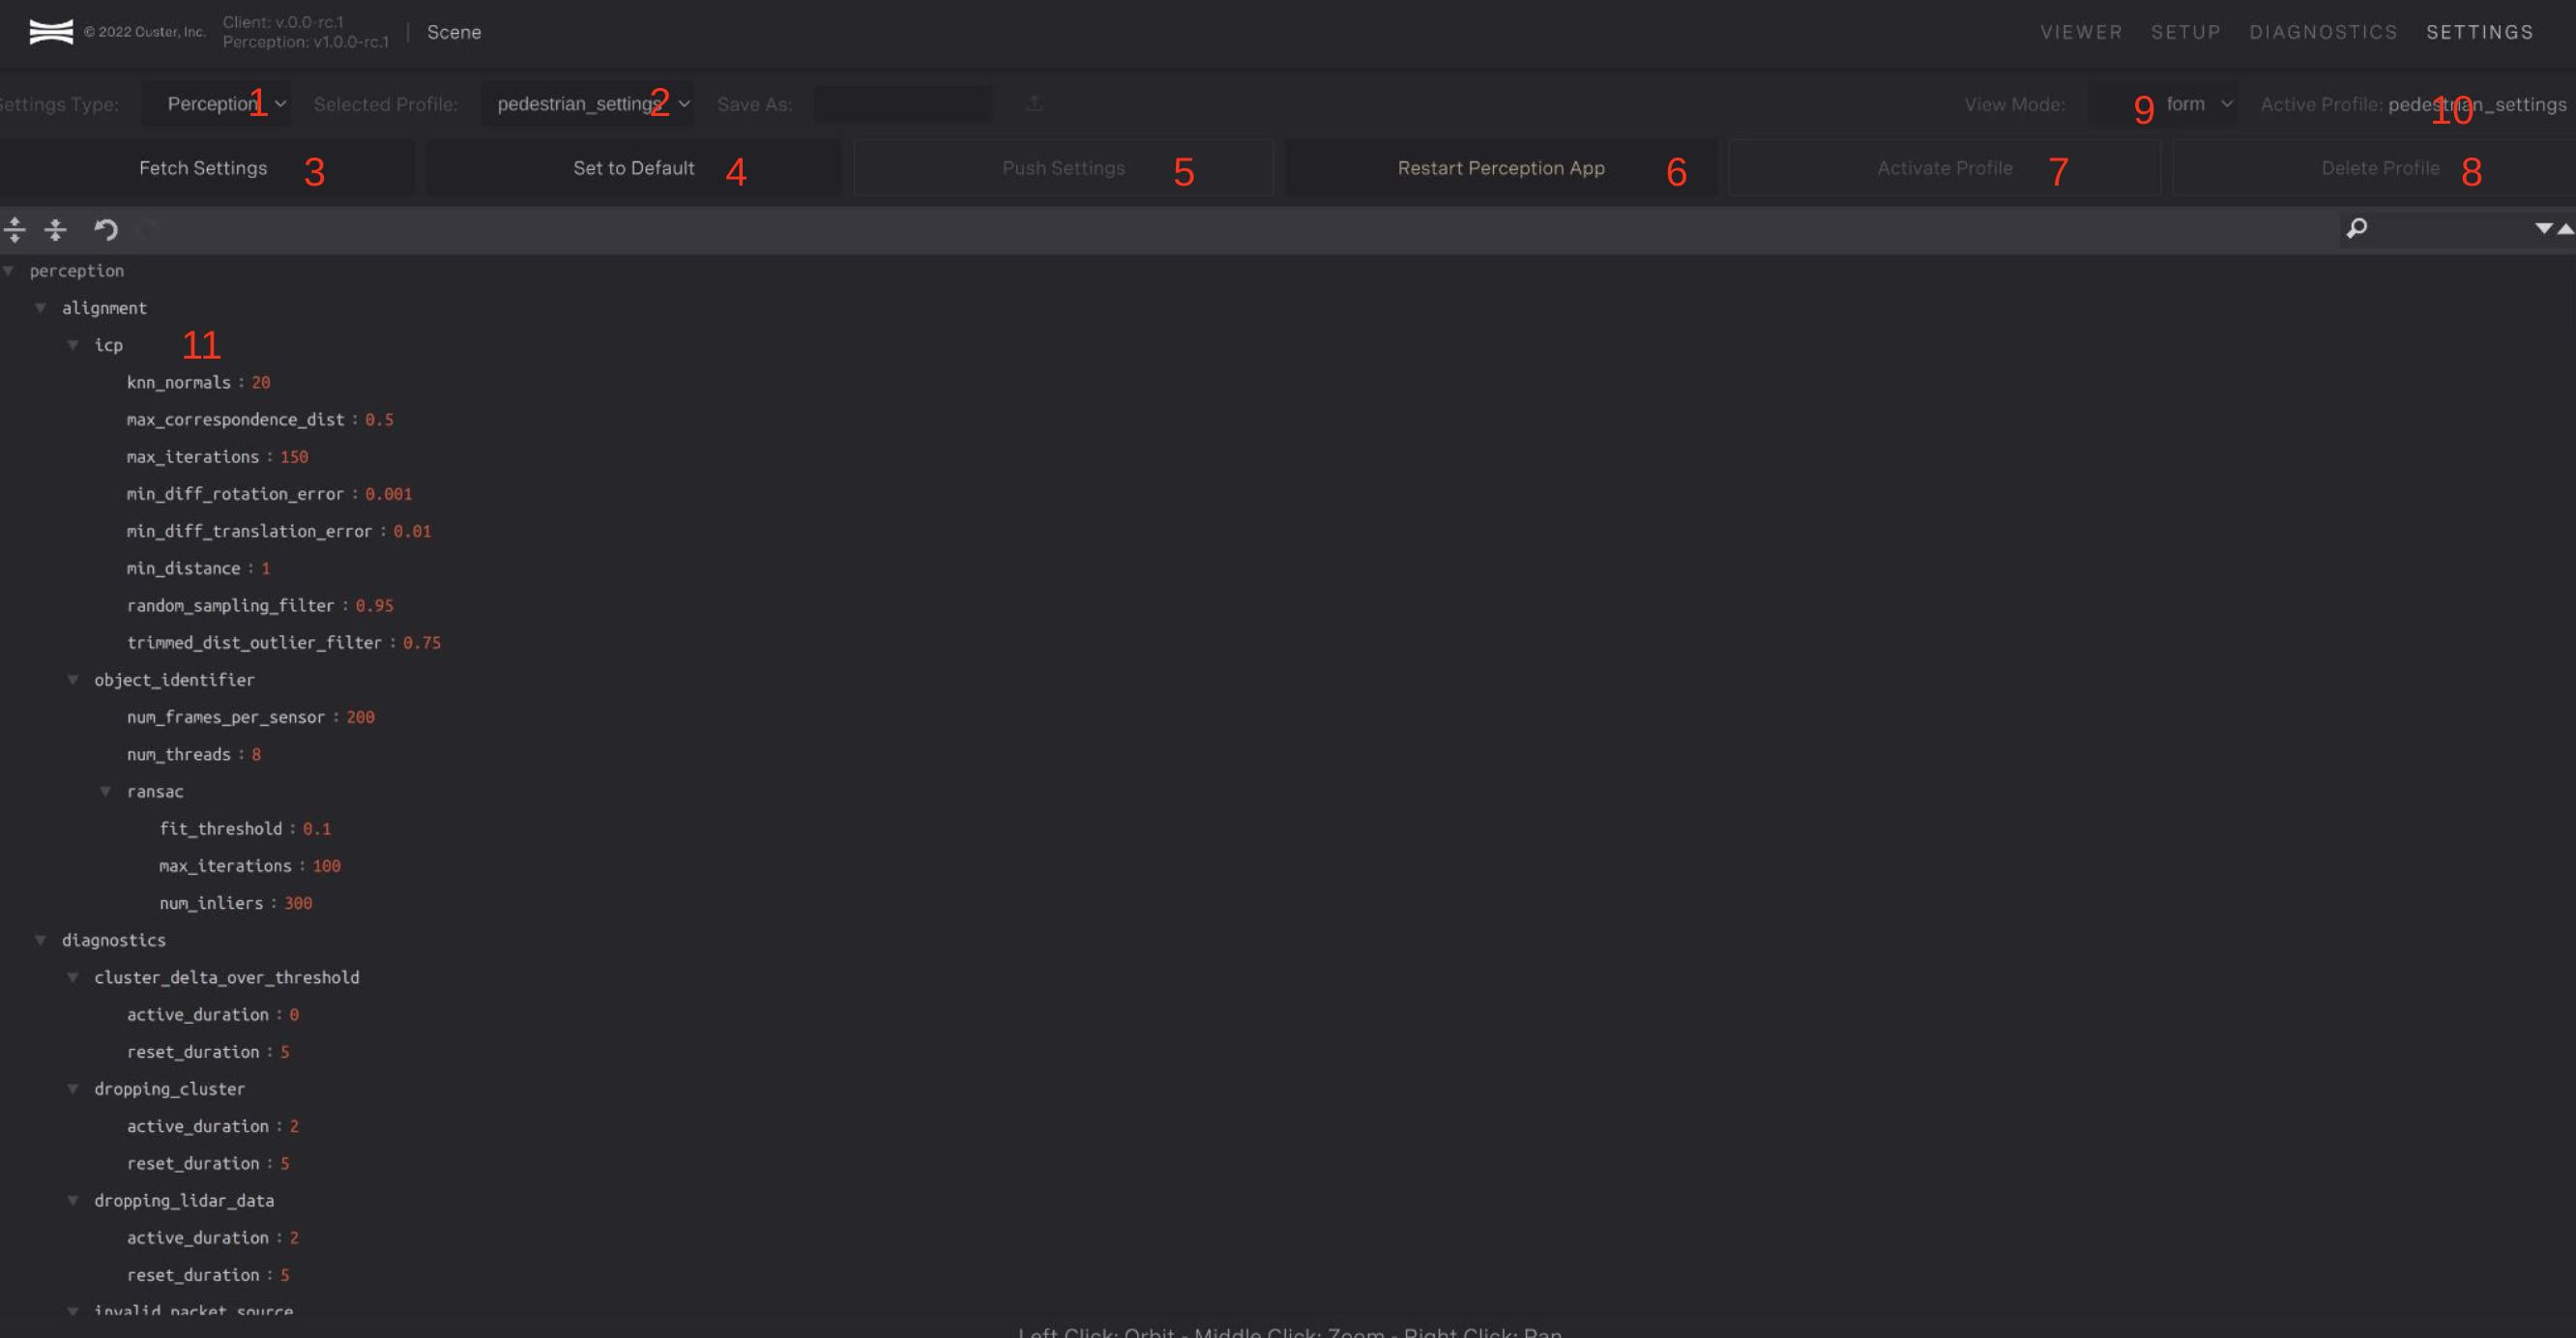
Settings Page
Component on the settings page are numbered in red in the reference image below and are described as follow:
A selection drop down for either Perception or Lidar Hub settings.
A profile drop down to select from preconfigured profiles for different scenarios. Additional changes to profiles can be made but they provide a good starting point.
Button to grab the current settings from the the server. This will erase local changes that have been made to the settings
Button to reset the settings back to the default settings for the chosen profile
Button to push settings to the server
Button to restart the perception application
Button to change the settings on the based on the profile chosen
Button to delete the chosen profile
Chose between a tree and from view mode. The tree mode gives more control over settings, allowing you to add new ones and move them around to different sections. The form mode is more restrictive but prevents you from adding new settings that will not work. Tree mode is currently only available for LidarHub settings.
Indicator of the active profile on the server
JSON pane
JSON Pane
The JSON pane shows the the settings that have been fetched from the server. Settings can be changed interactively clicking in invidual values and changing them. Types are restricted to match the previous type. Changes will not affect the server until the Push Settings button is clicked.
To help find and edit settings the settings are shown in a nested view. Hide/Expand arrows can be used for sections. Specific settings can be searched for in the top right of the pane.
For the perception, all settings are listed on the JSON pane. For LidarHub new settings and sections can be added when operating in tree form.
Settings profiles
Settings profiles are predefined groups of settings optimized for certain use cases. By default, Ouster Gemini Detect is optimized for detecting people. To change the settings profile, click the “Selected Profile” drop down in the top-left corner and select the desired profile. After selecting the profile, a confirmation dialog will appear confirming your selection.
See Profiles for more information settings profiles and what they’re optimized for.
NETWORK
Network Configuration
The network configuration for the edge device running Ouster Gemini Detect can be found on the Network page. The Network page allows you to view the LAN configuration of all network interfaces, view the firewall rules applied to the edge device, and perform network tests.
View Network Interface
The configuration of any network interface can be viewed when selecting the LAN view in the preferences pane on the left side of the Network page.
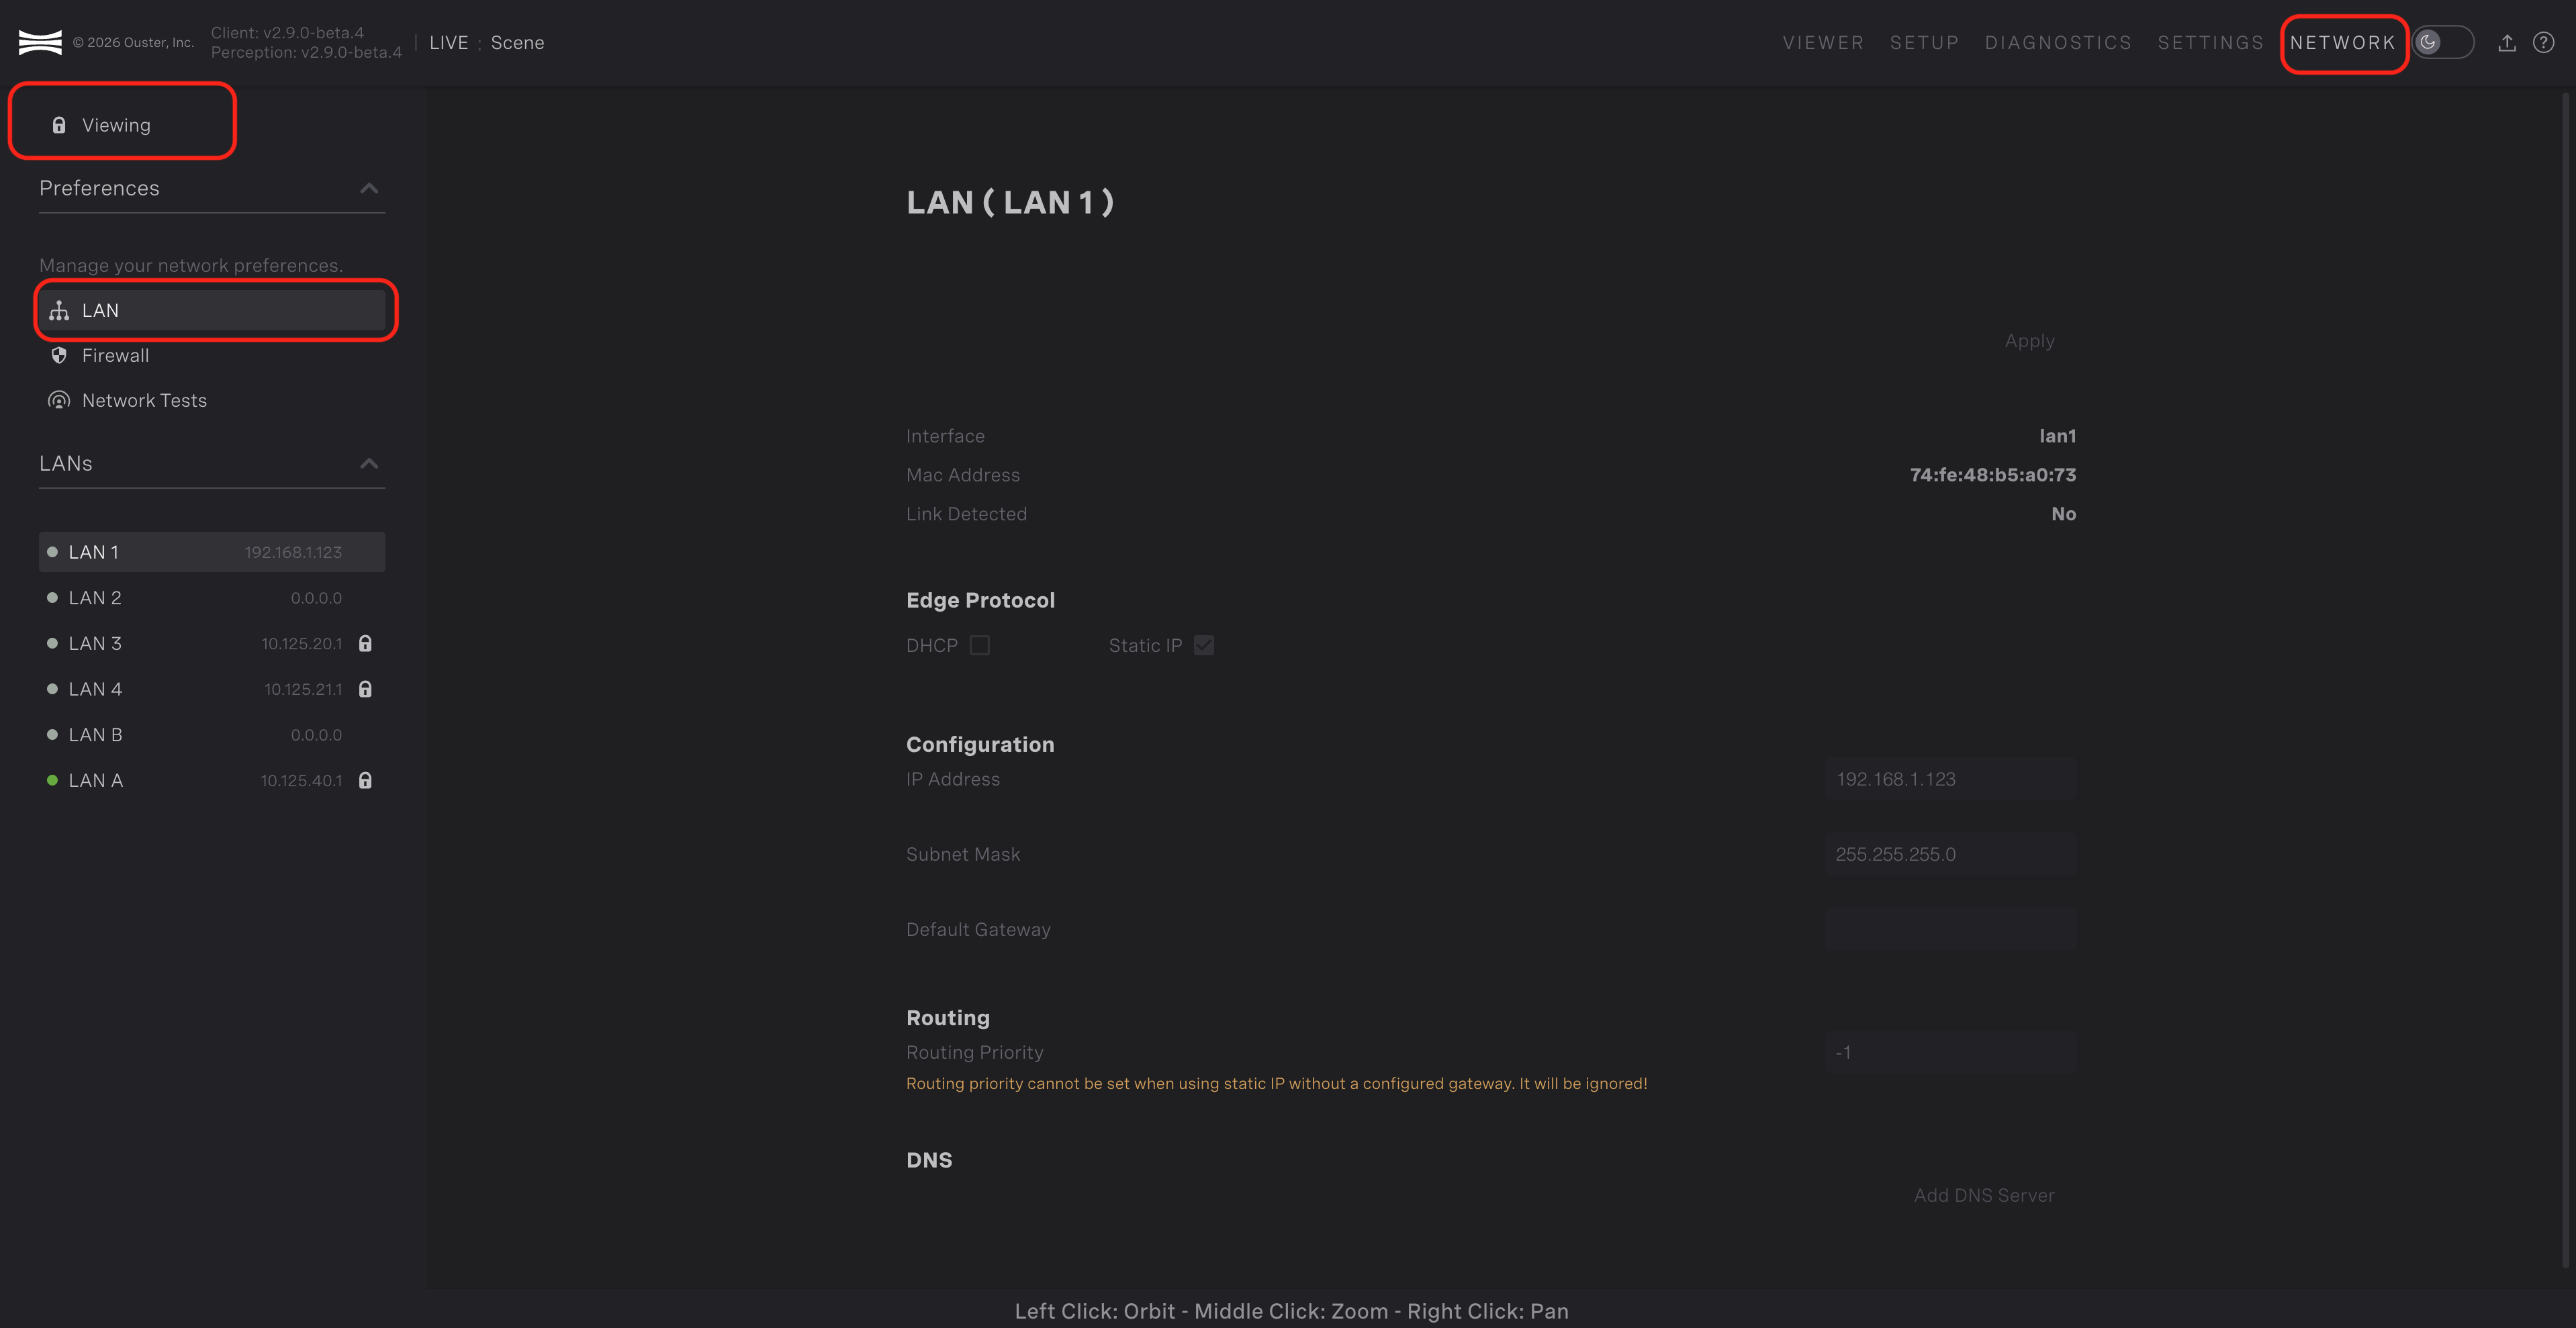
LAN view selected
Once the LAN view is selected, a list of network interfaces is displayed in the body of the page. You can click on the different interfaces to view the state of each. The dot to the left of the interface name indicates if the interface is physically connected to a device. Once an interface is selected, you can view the configuration in the main body of the page.
The configuration contains the following information
The linux interface name
The MAC address of the interface
Whether an active link is detected on the interface
Whether the interface is configured to use DHCP or a static IP address is configured
The IP address and subnet mask of the interface
The gateway of the interface (if applicable)
The routing priority of the interface (if applicable)
Edit Network Interfaces (Catalyst GPU only)
Specific network interfaces can be edited on the Catalyst GPU. We restrict the interfaces which can be edited to interfaces not designated for lidars and non-debug interfaces. The table below shows the interfaces the user is allowed to edit for each Catalyst device.
Device |
Configurable Interfaces |
|---|---|
Catalyst GPU |
LAN1, LAN2 |
The lock configuration status in the top-left corner of the Network page shows whether you’re viewing or editing the interface. Clicking on the status will toggle which mode you’re in. Click on the status to enter Editing mode while in Viewing mode and vice versa.

Lock status
Once in Editing mode, you can edit the configuration of the interface. You can toggle between DHCP and Static IP under the Edge Protocol section. When configured for DHCP, the interface will attempt to retrieve a DHCP address from an active DHCP server.
In this case, the Viewing column below will show the information retrieved on a successful DHCP lease. When configured for Static IP, you can configure the desired IP address and subnet mask in the Editing column. You can optionally specify a gateway address and routing priority to configure the routing table as desired. Once the desired changes are entered into the page, click the Apply button in the top-right to apply the changes. Once the changes have been applied, you should see the changes reflected in the Viewing column.
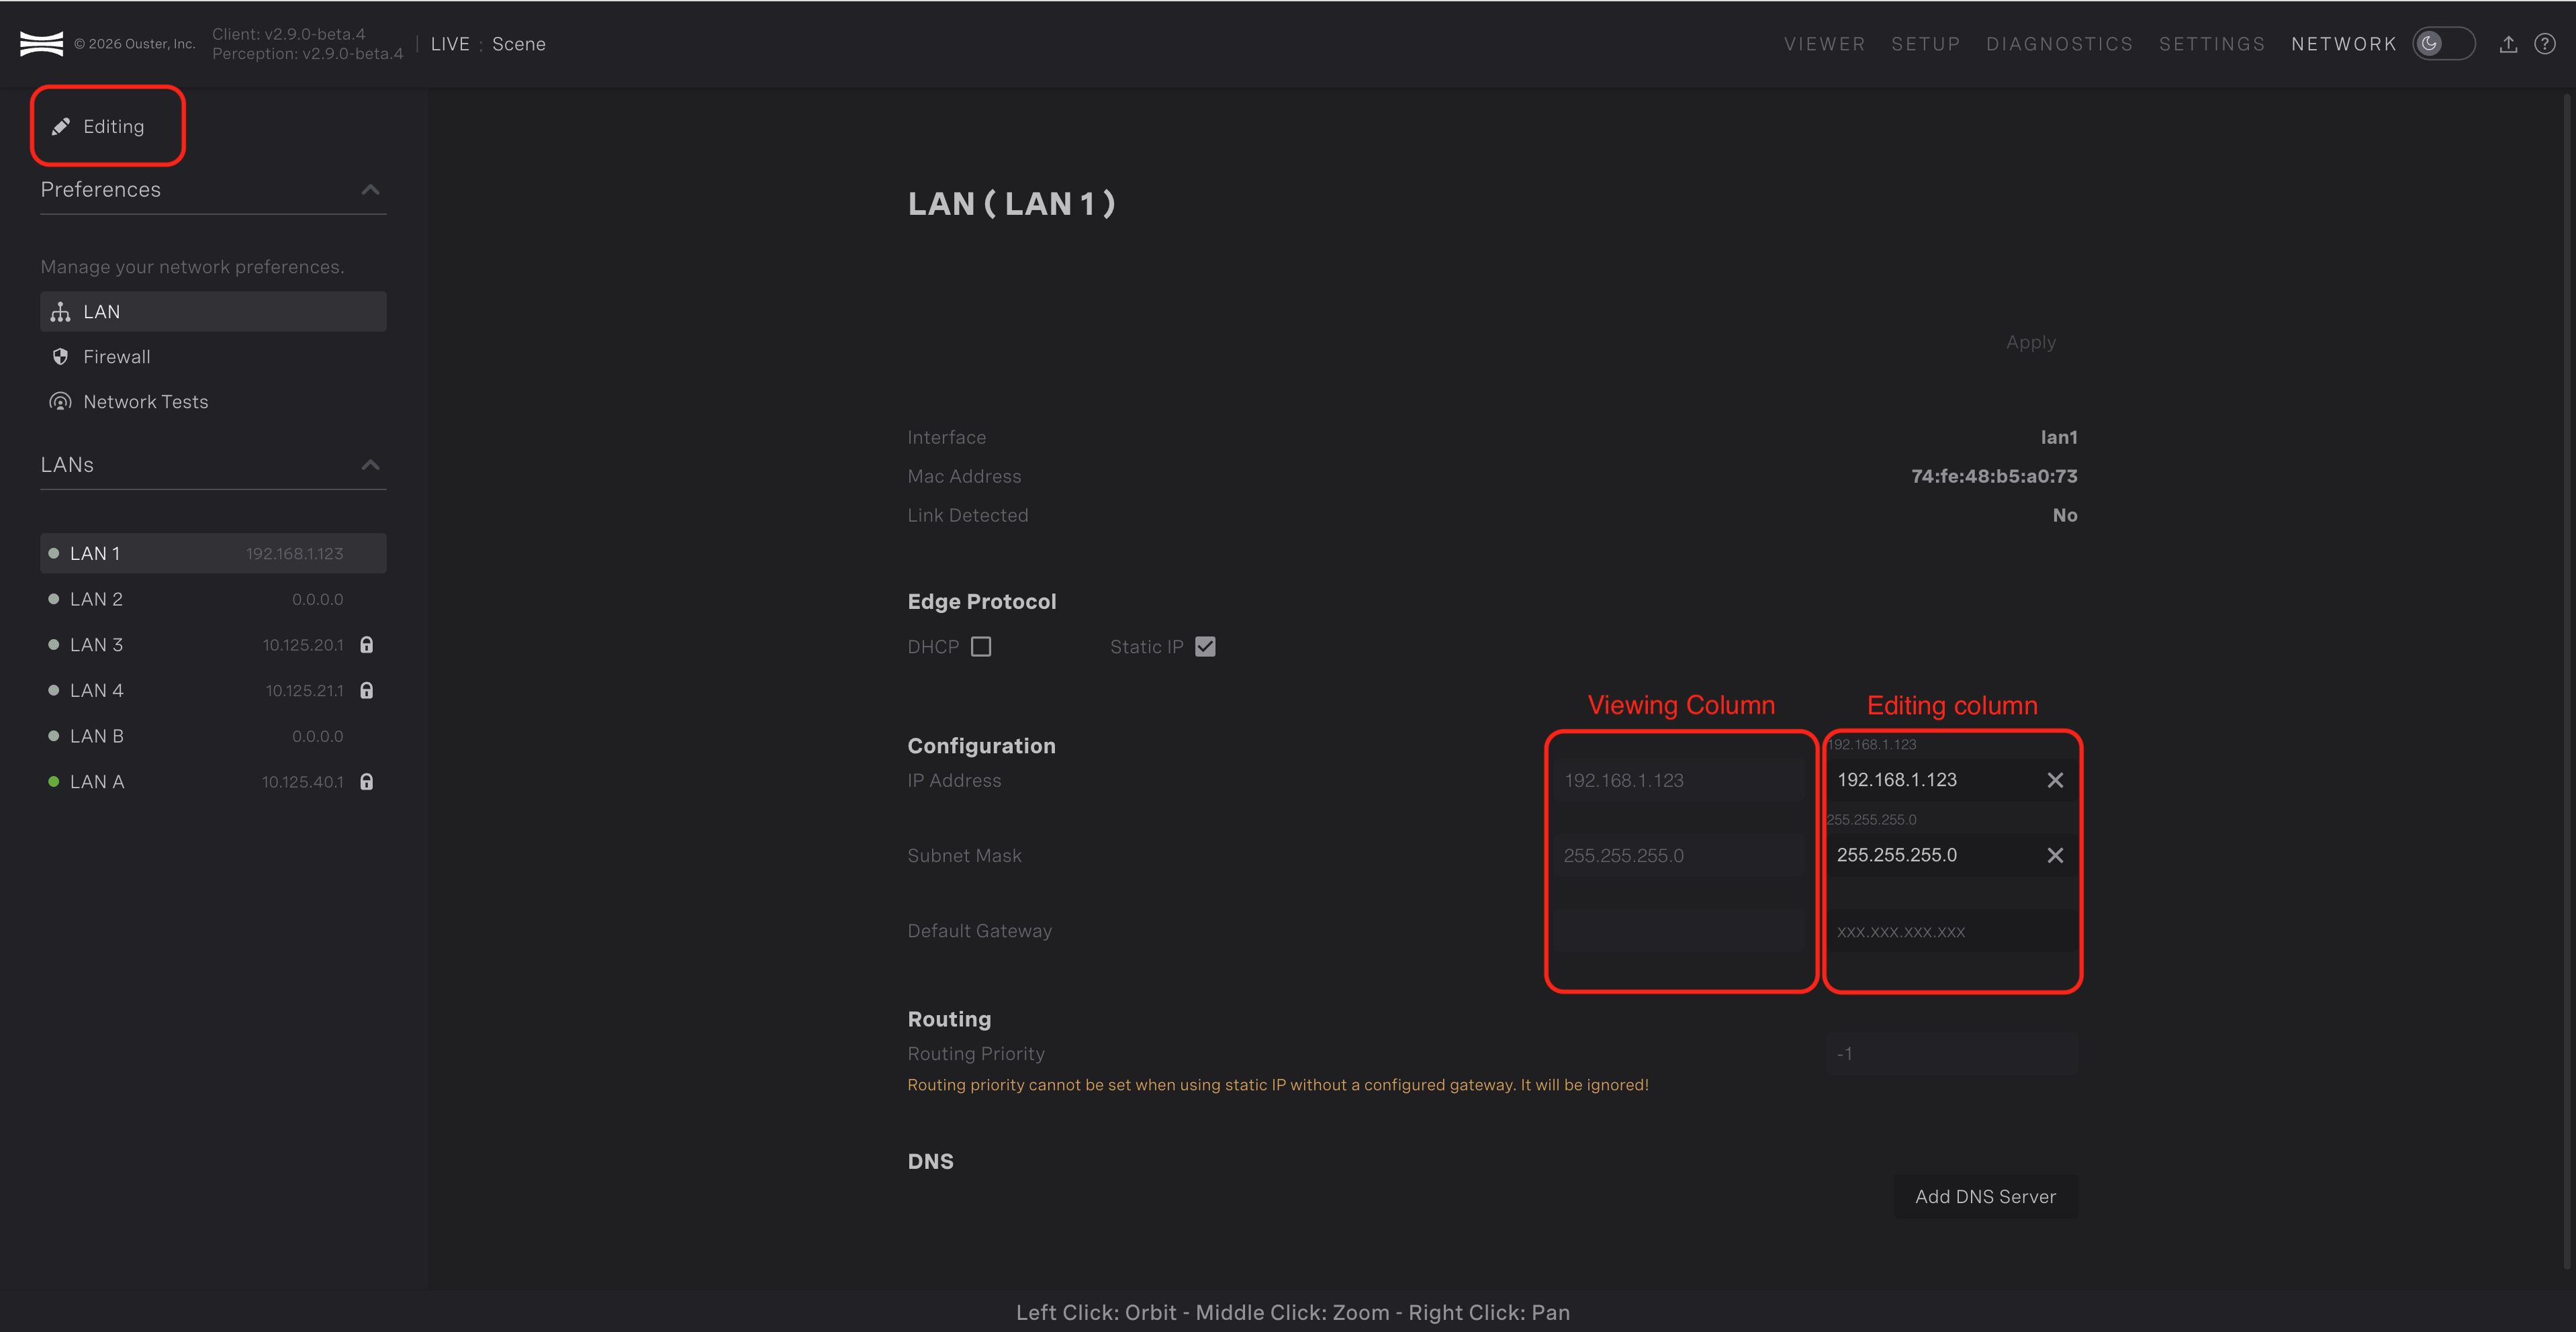
Editing network interface
Note
If you change the configuration of an interface and prevent yourself from being able to re-connect, you can always use the debug network port to establish a connection and revert any changes. The IP address of the Catalyst device is always 10.125.100.1 on the debug network port. The Catalyst device has a DHCP server to issue DHCP leases to any connected devices. In most cases, connecting a device to the debug network port and navigating to 10.125.100.1 in a browser will give you access to the Detect Viewer.
View Firewall Rules
To view the firewall rules applied to the edge device, select Firewall in the preferences pane on the left side of the Network page.
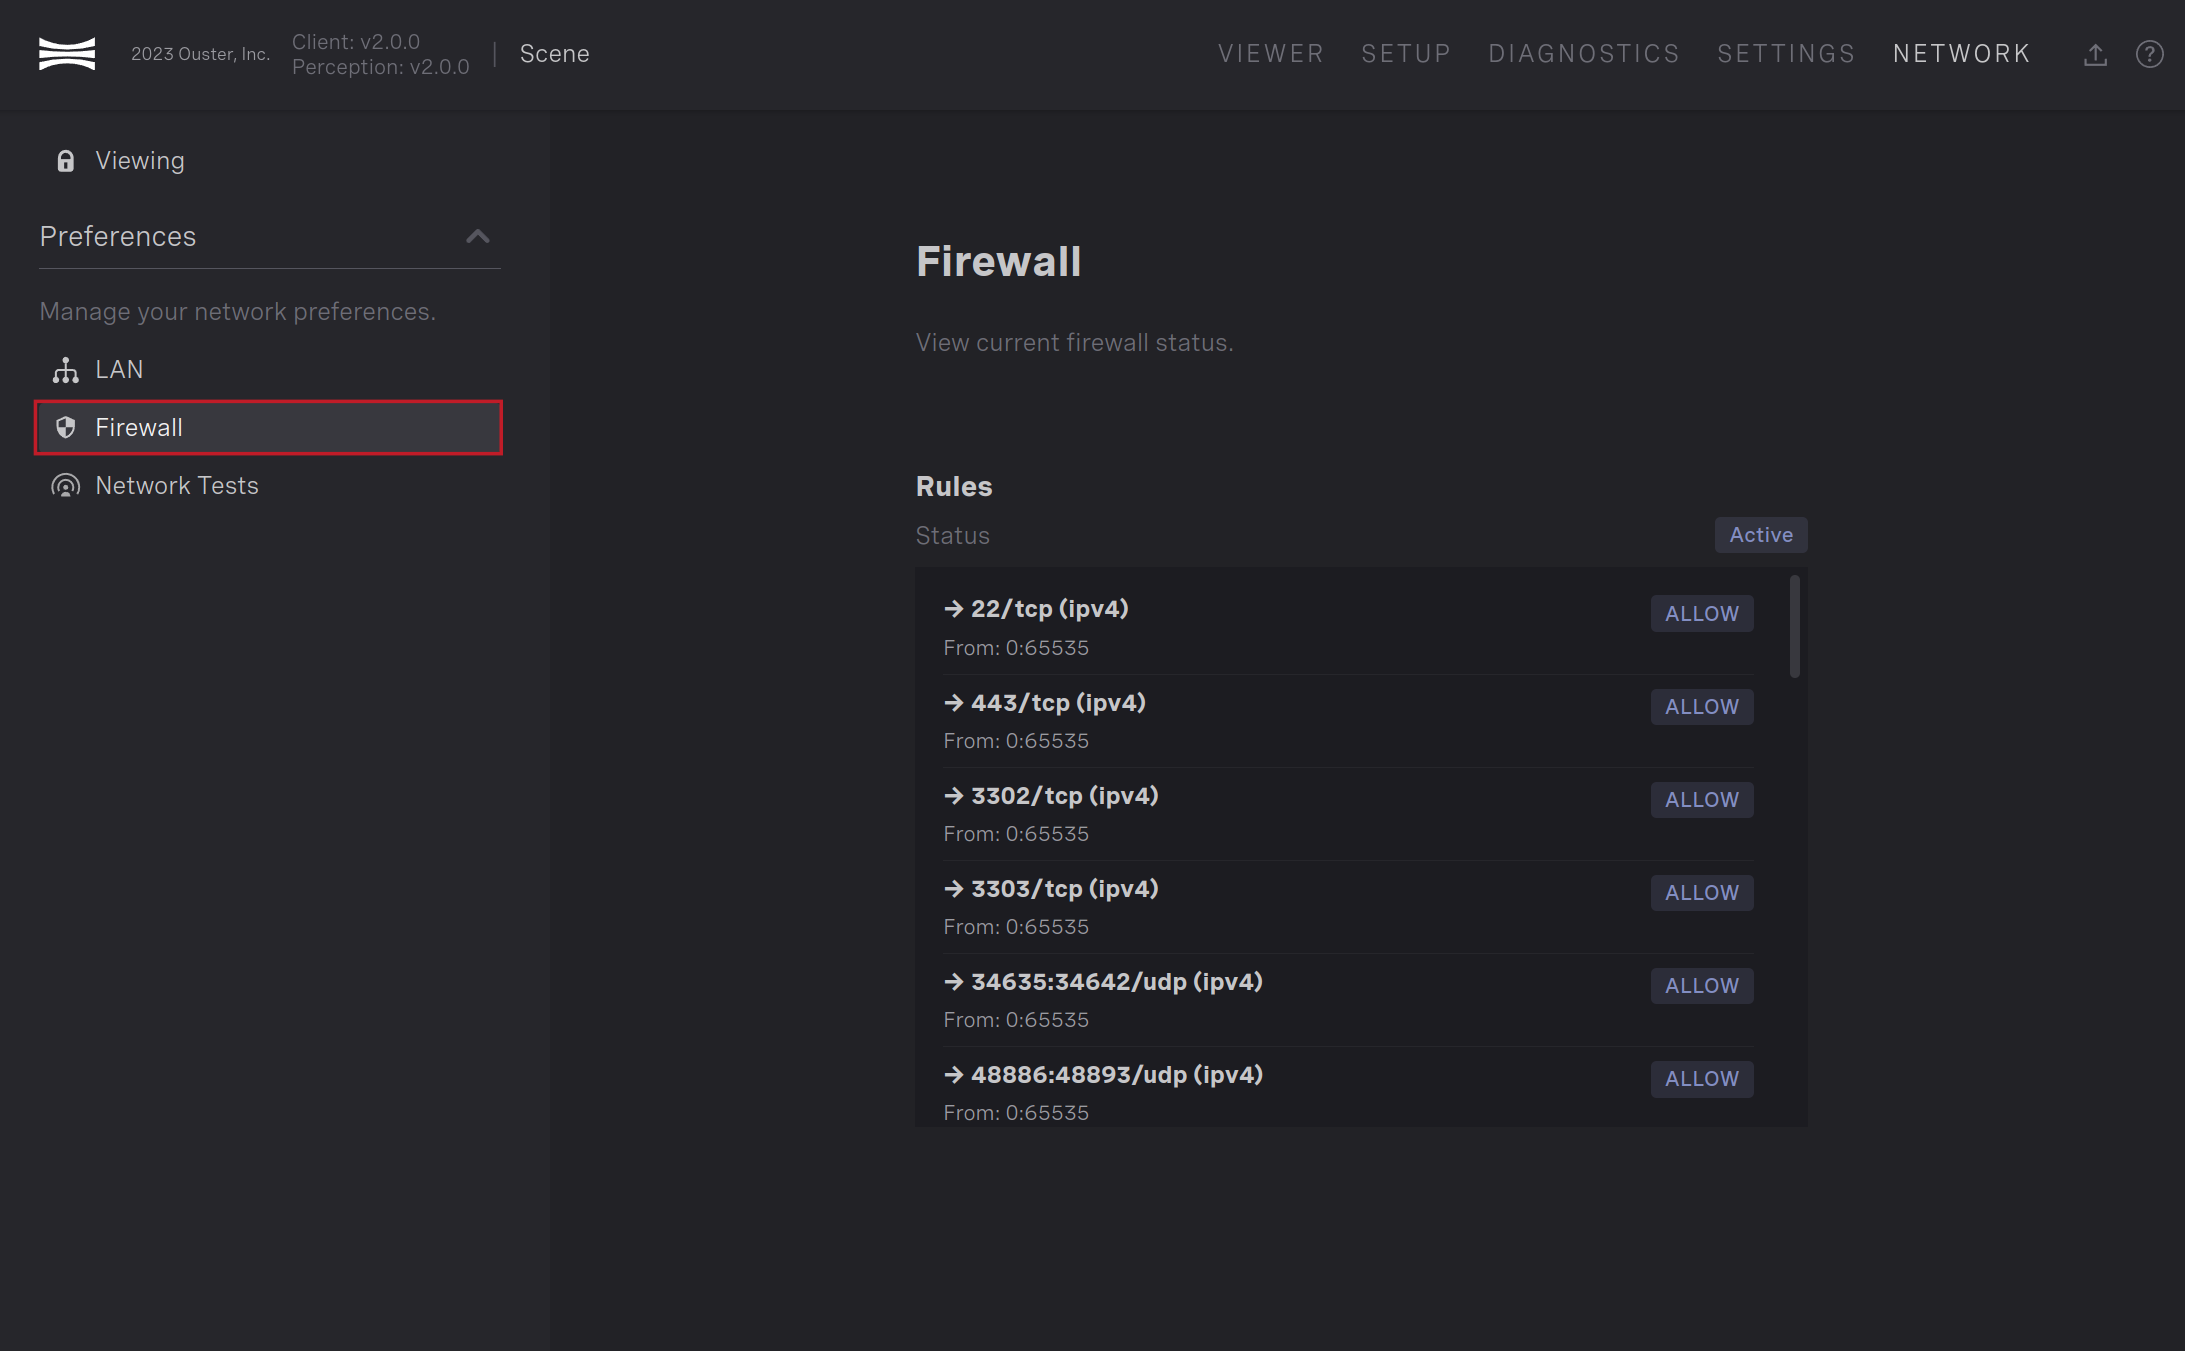
Firewall selected
Perform a ping test
If you need to confirm the edge device can reach a specific IP address, you can perform a ping test under the Network Tests section on the Network page. Enter the IP address you want to confirm connection to and click Begin to start the test. The page will show you the round-trip time of the ping request if successful.
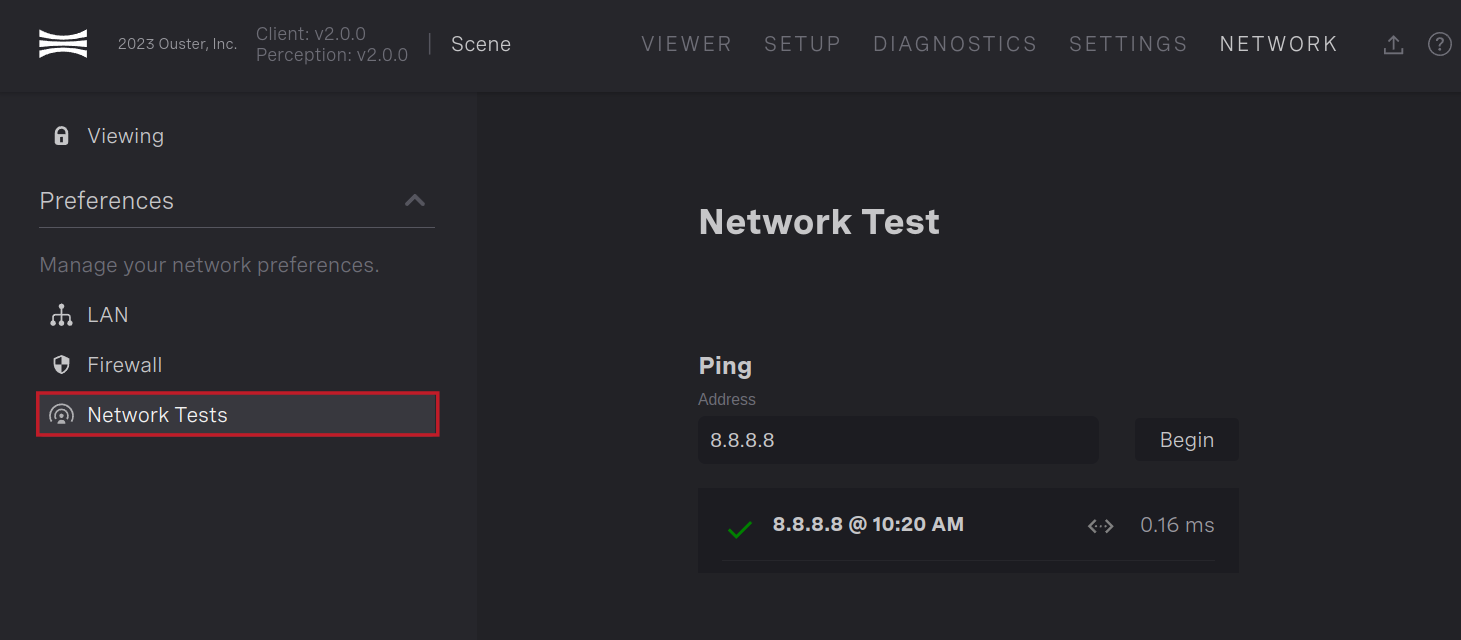
Ping test
MISCELLANEOUS
Updating Software
Note
If you want to upgrade from a system running Detect 1.3 or earlier, you need
to run the get-detect.sh script. Please follow the instructions in
Install Detect via get-detect.sh. You can also use the get-detect.sh
script to update systems running Detect 2.0 and later.
Ouster Gemini Detect software can be updated by providing an archive with the new version of the software through the Detect Viewer. See Tar Archive Download for more information on downloading the appropriate archive.
Once the archive is downloaded, the edge device can be updated through the Detect Viewer. Once logged into Detect, select the software upload button in the top-right corner of the page. A window will pop-up allowing you to select the archive to upload.
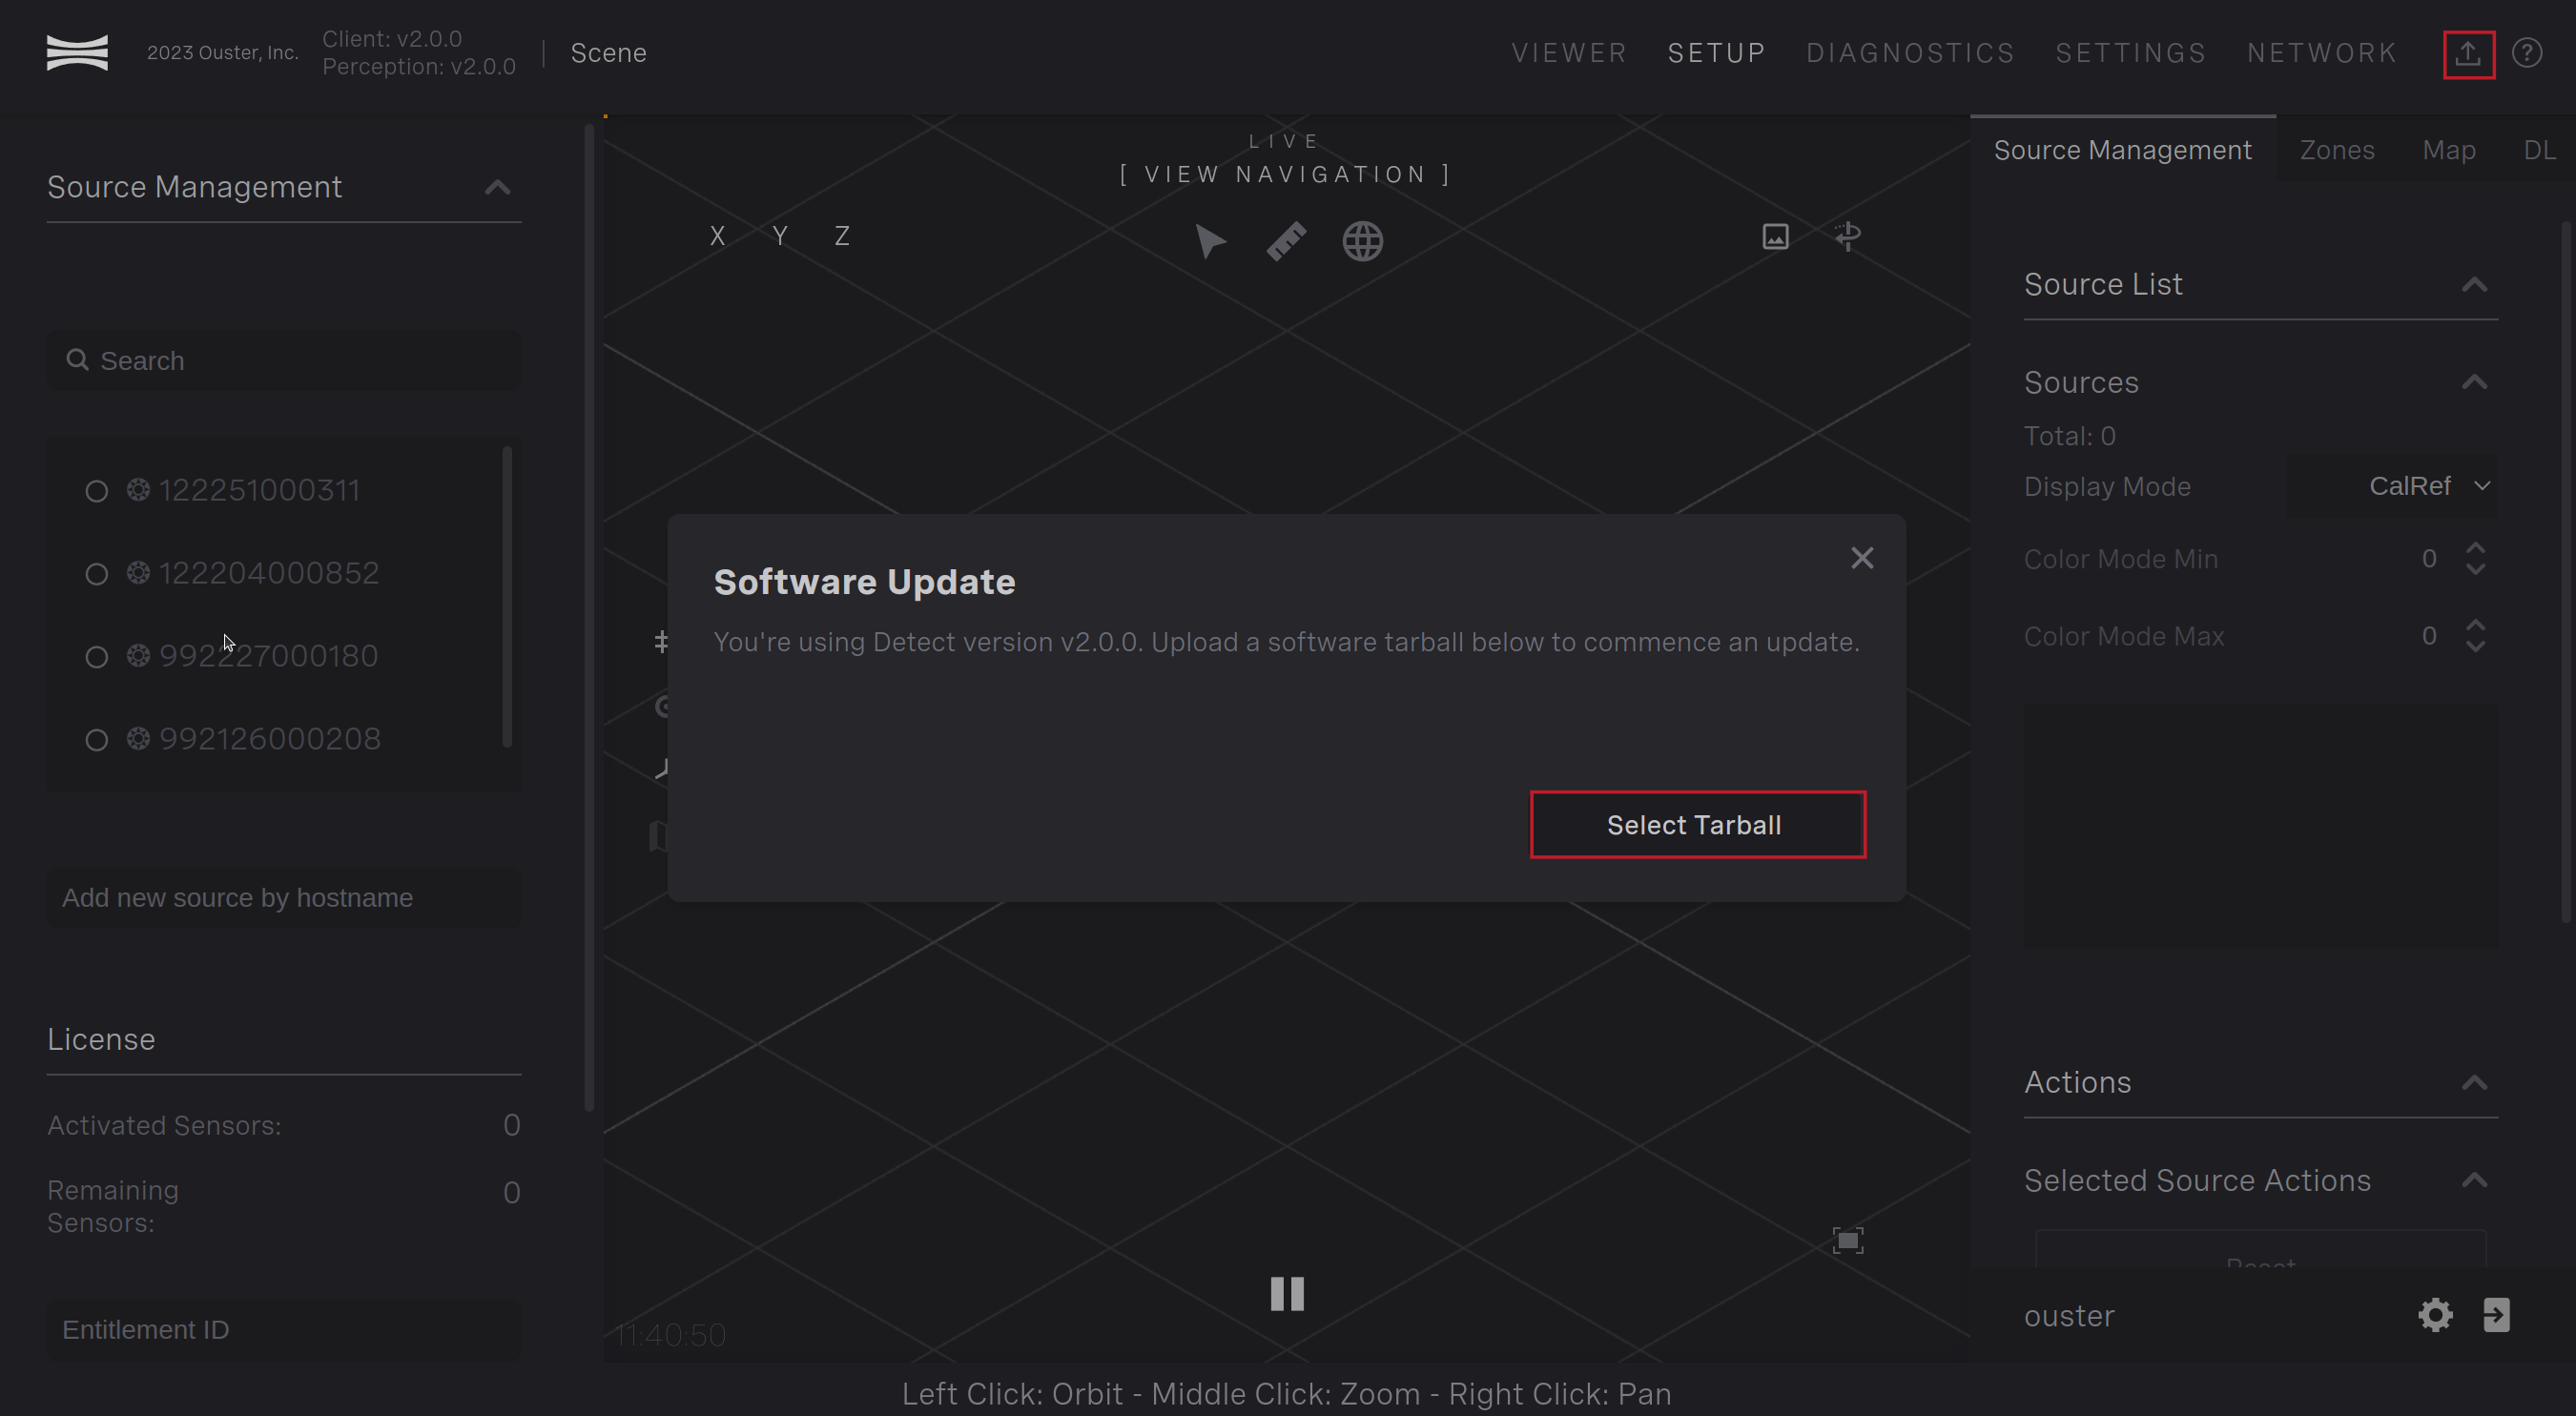
Software update button
Once you’ve chosen your archive downloaded from the Ouster Registry, click Start Update. The pop-up window will indicate the progress uploading the archive.
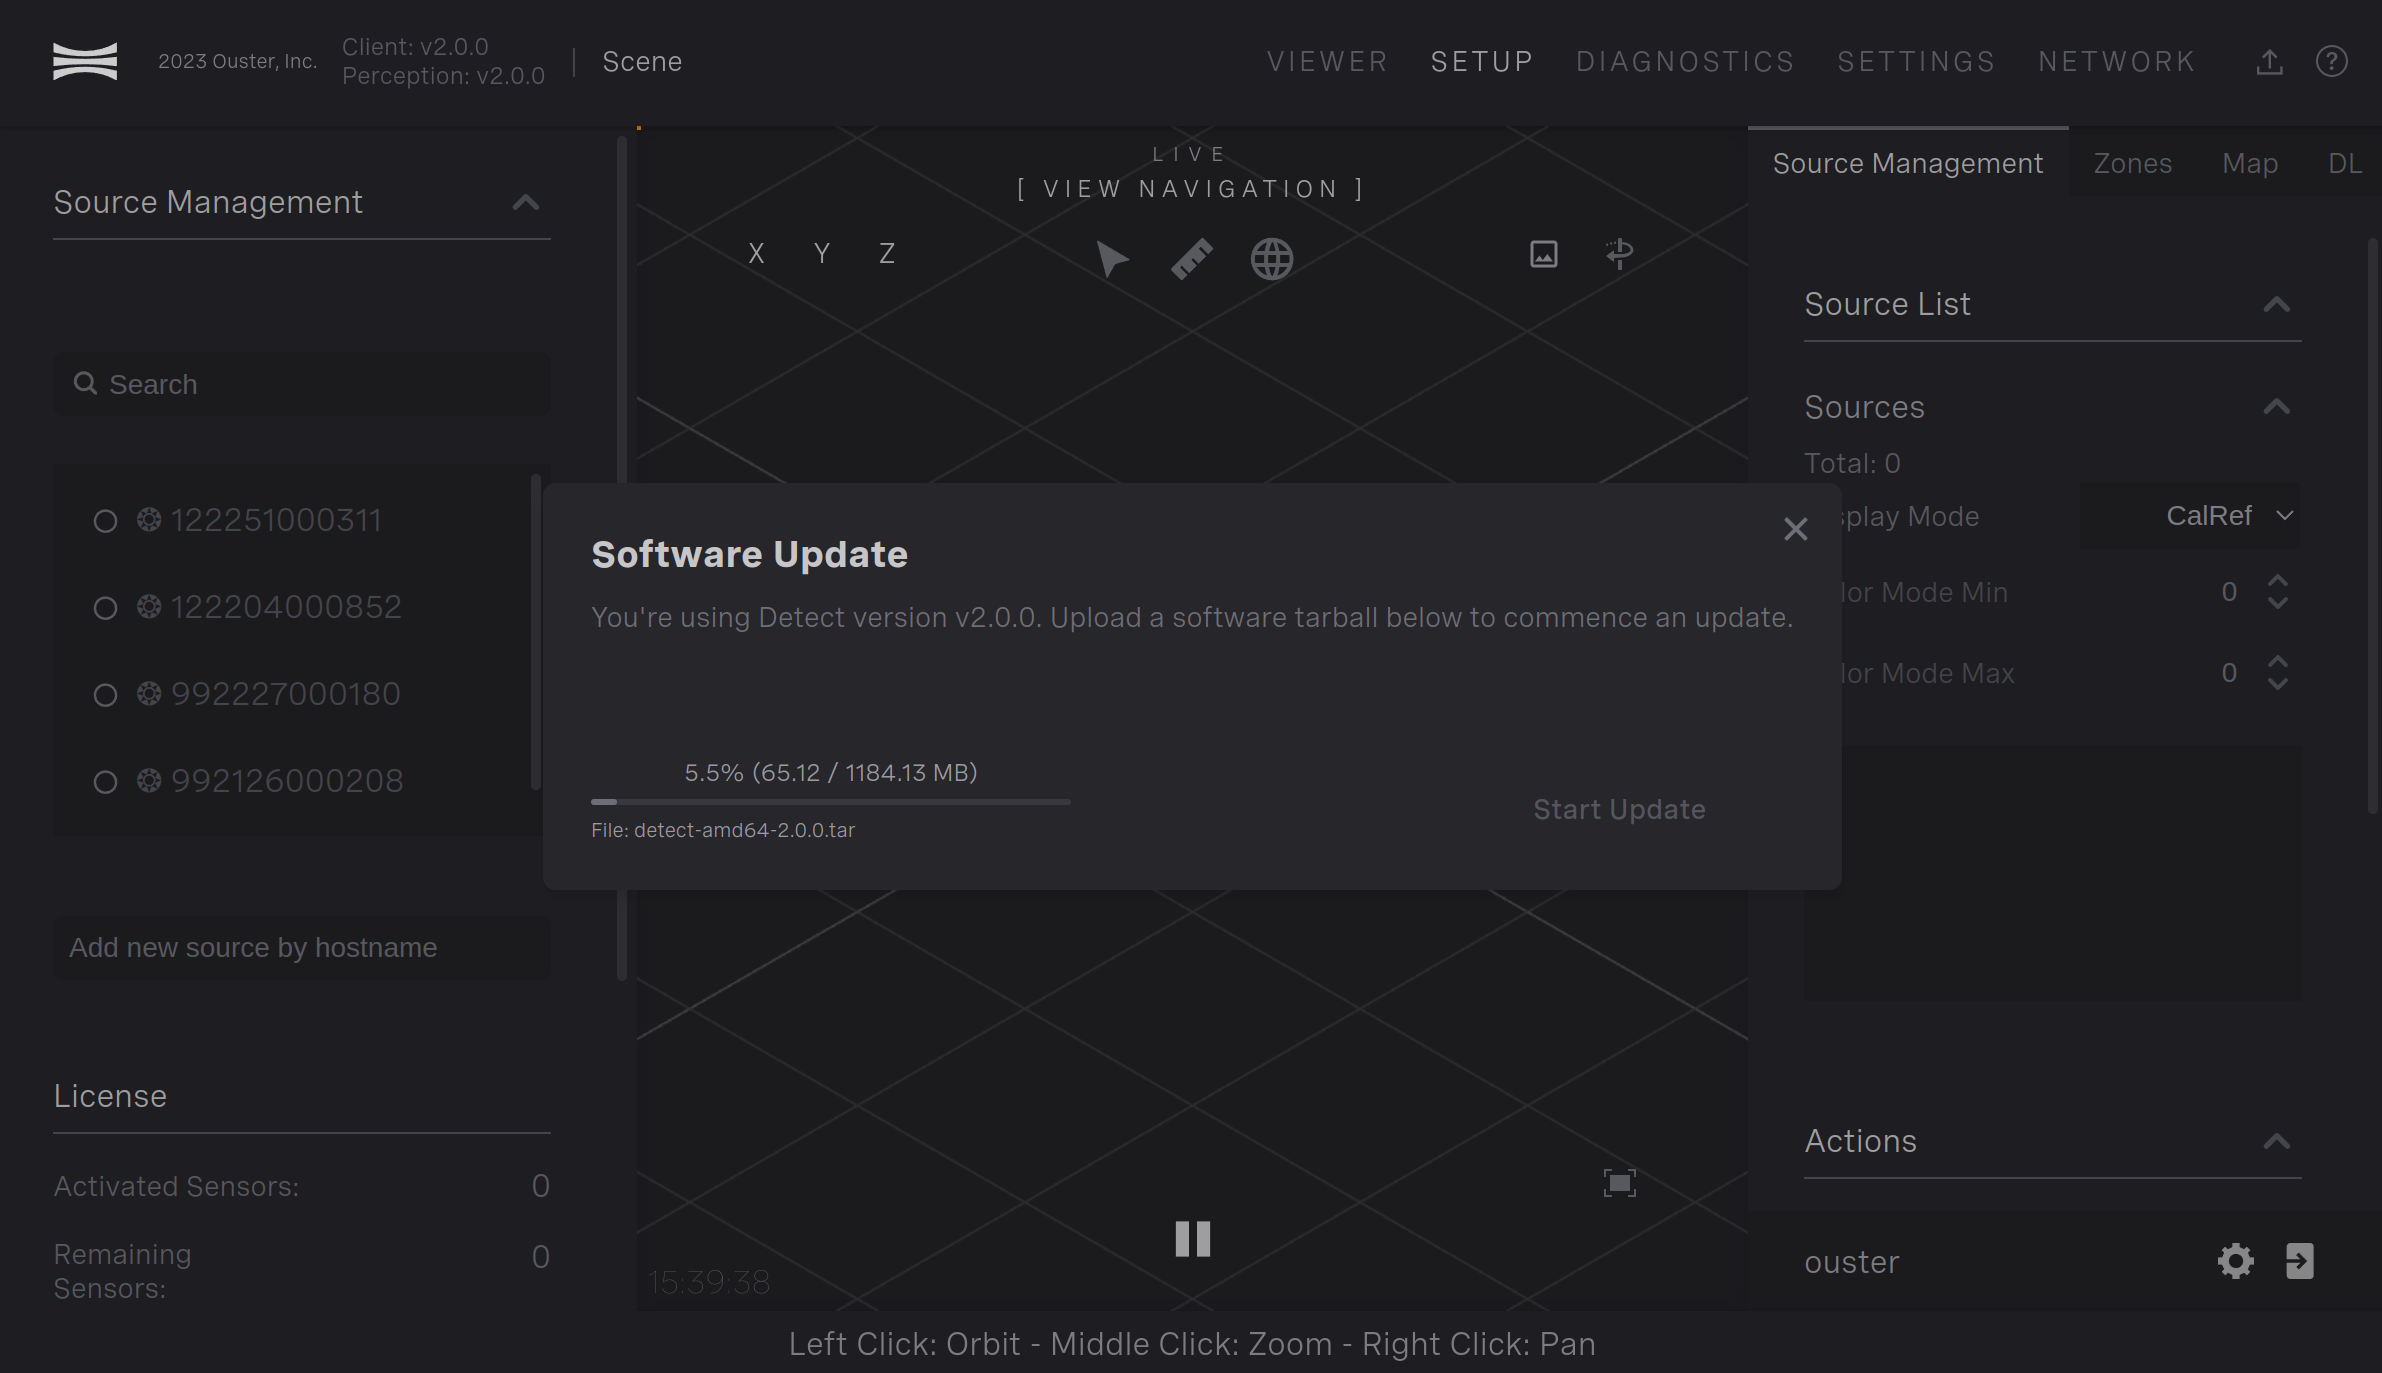
Software Update Progress Bar
Once the archive is uploaded and validated, the pop-up window will indicate that the update has started.
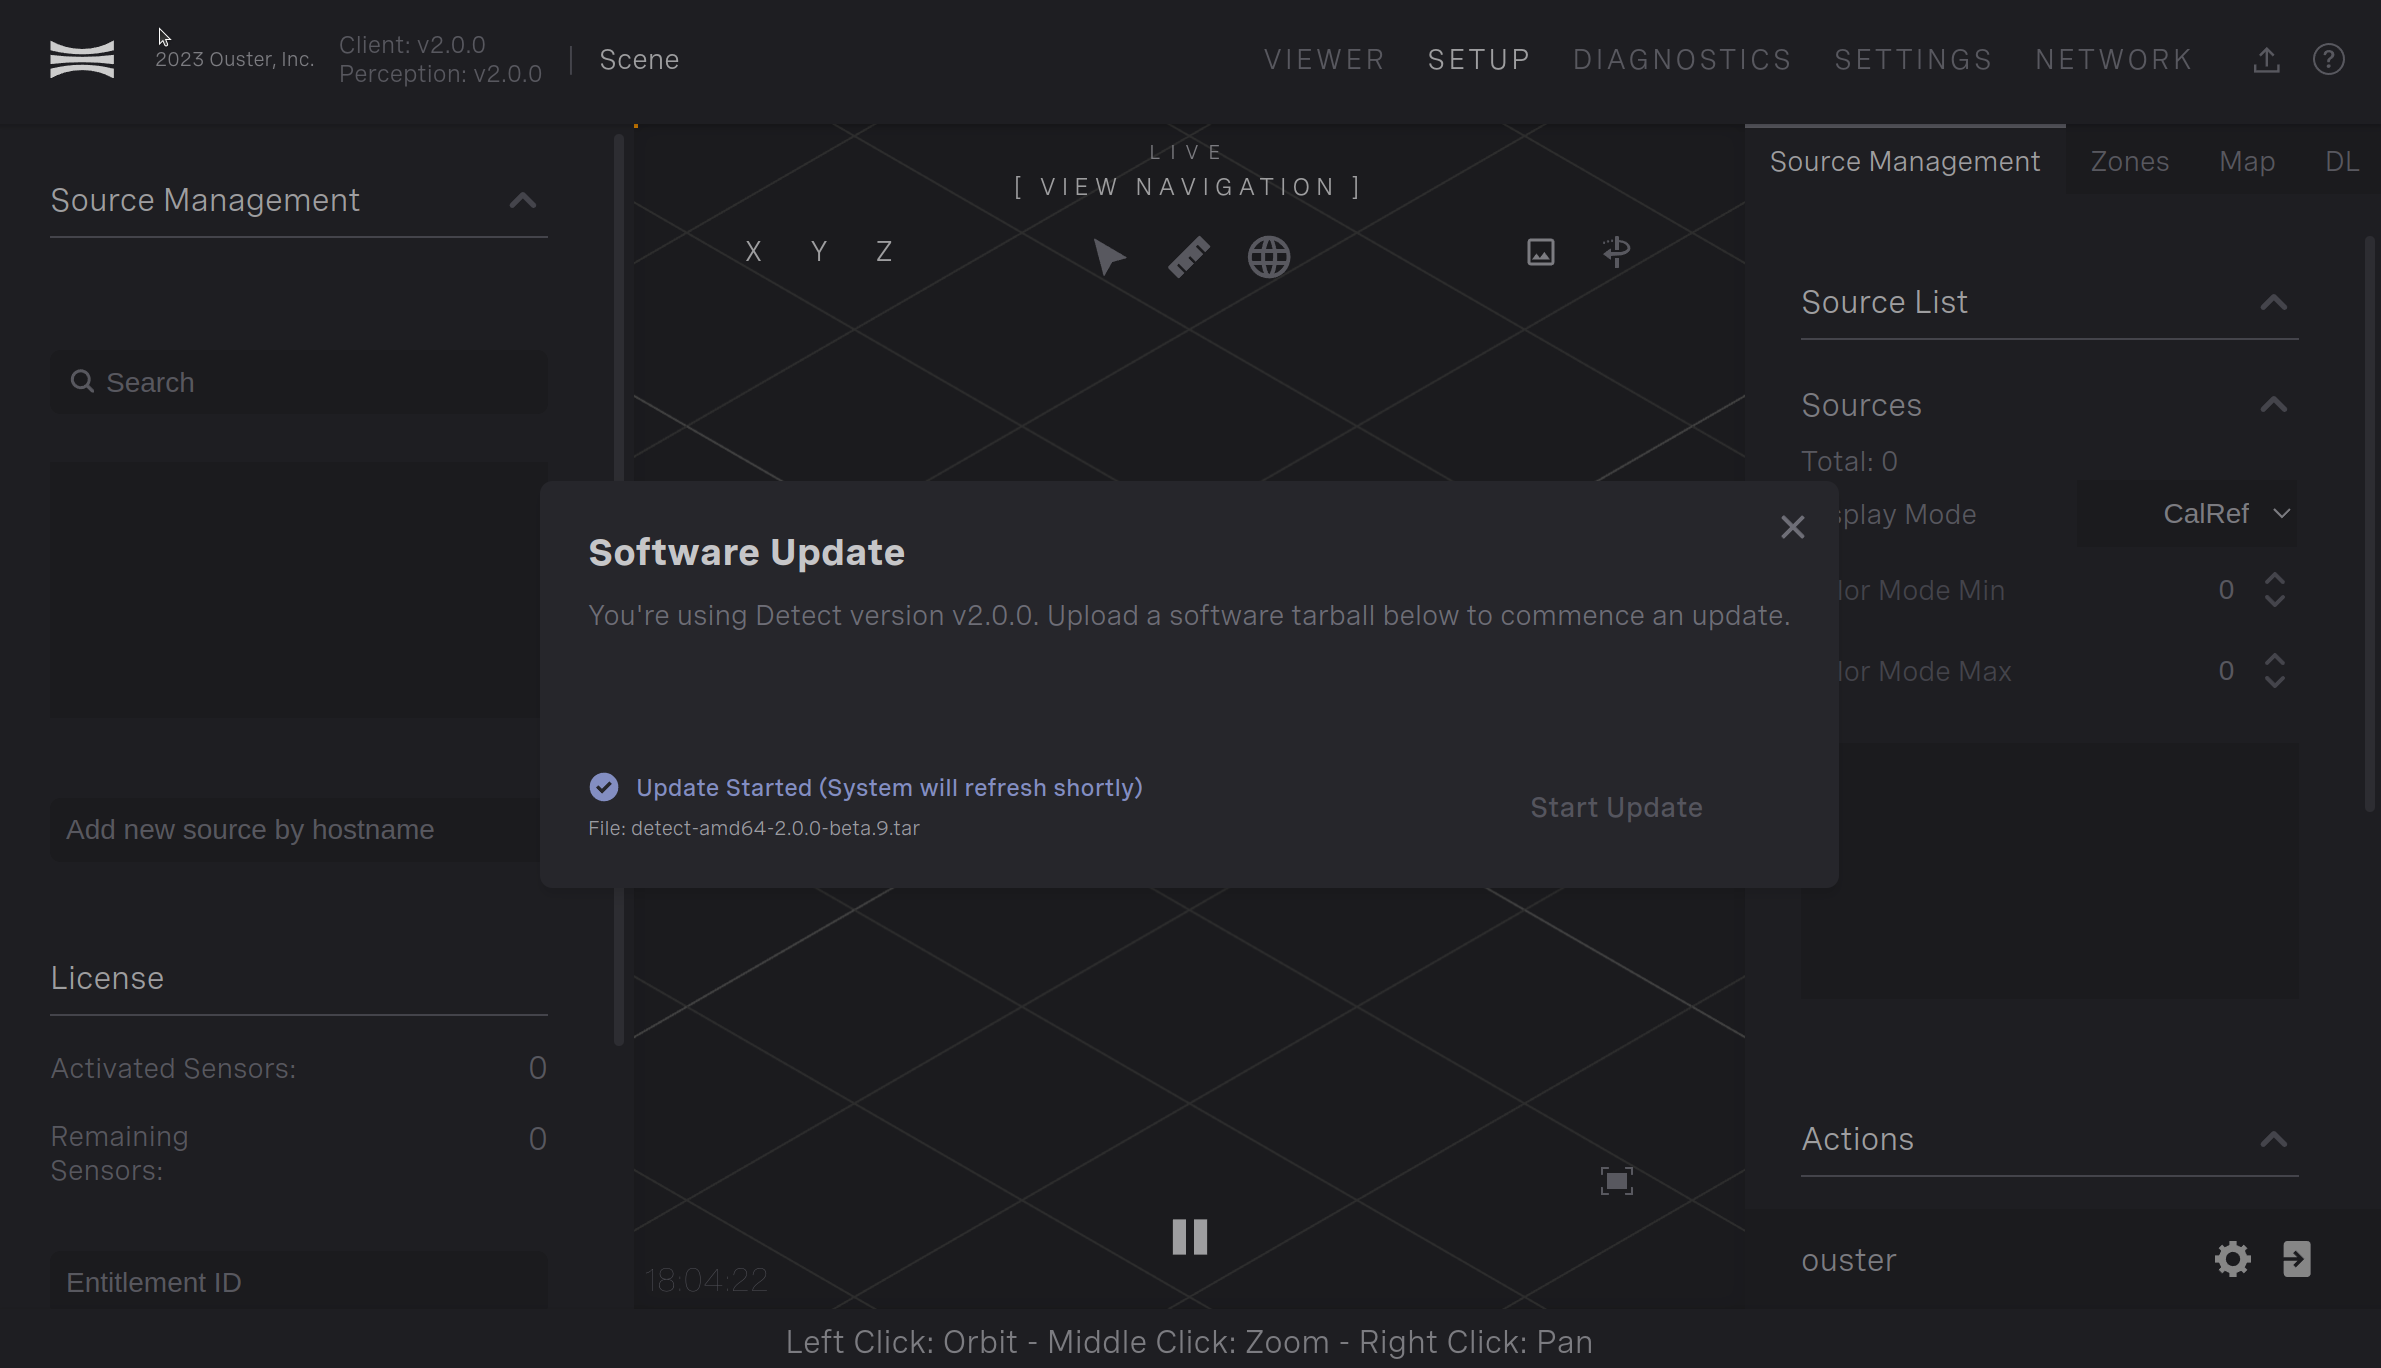
Software Update Started
This window will show indefinitely while the update is happening on the edge device and persist after the update is complete. The update takes ~2 minutes to complete. After this time, refresh the browser to login to the updated version of Detect. You’ll be able to login with your original credentials before the update.
If you refresh the browser before the update is complete, you may see a site cannot be reached error. If this occurs, wait up to 10 minutes and try refreshing again. If you still cannot access the login page after 10 minutes, please contact support@ouster.io.
Sensor Blockage
Detect has the ability to identify if a portion of the a sensor’s field of view is blocked. Blocked in this case means there is a portion of the field of view where sensor returns were visible in the past but are now obstructed by an object which is closer. Blockage detection is useful to identify when a bad actor is attempting to compromise the system or if an object is inadvertantly placed obstructing the field of view of a sensor.
Detect is continuously monitoring each sensor’s data in attempt to identify if it’s blocked. If blockage is identified for 3 seconds, alert 0x2000016 will become active. This alert will be active in the Detect viewer and retrieved through the active alerts.
The blockage detector detects if obstacles close to the sensor have moved. Therefore, if the sensor is mounted against a wall, the wall will not trigger the alert. However, if the sensor is moved relative to the wall, Detect will identify the wall as having moved and trigger the alert. To reset the alert, the user must save the alignment on the Setup page. This should be done anyway if the sensor is moved to make sure the new sensor location is reflected in Detect.
The blockage detector is disabled by default because it can give false positives in some situations. For example, if the connection between the sensor and Detect is poor and lidar data packets are being dropped, the blockage detector will give false positive alerts. To enable the blockage detector, enable it in the Settings. Go to the Settings page and navigate to perception.lidar_pipeline.blockage_detector.enable and change this to True.
See Adjust sensor blockage detector for information on tuning this functionality.