Point Cloud Visualizer
The Ouster visualization toolkit is written in C++ with Python bindings for Python functionality. It consists of the following:
simple-viz(viz.SimpleViz): the default Python application visualizer, which can also be used as an entrypoint for more sophisticated custom point cloud visualizationsouster_viz: the core C++ libraryouster.sdk.viz: the Python module for the bindings
Using ouster-cli is a fastest way to visualize data from a connected sensor, recorded pcap
or OSF files with SLAM poses:
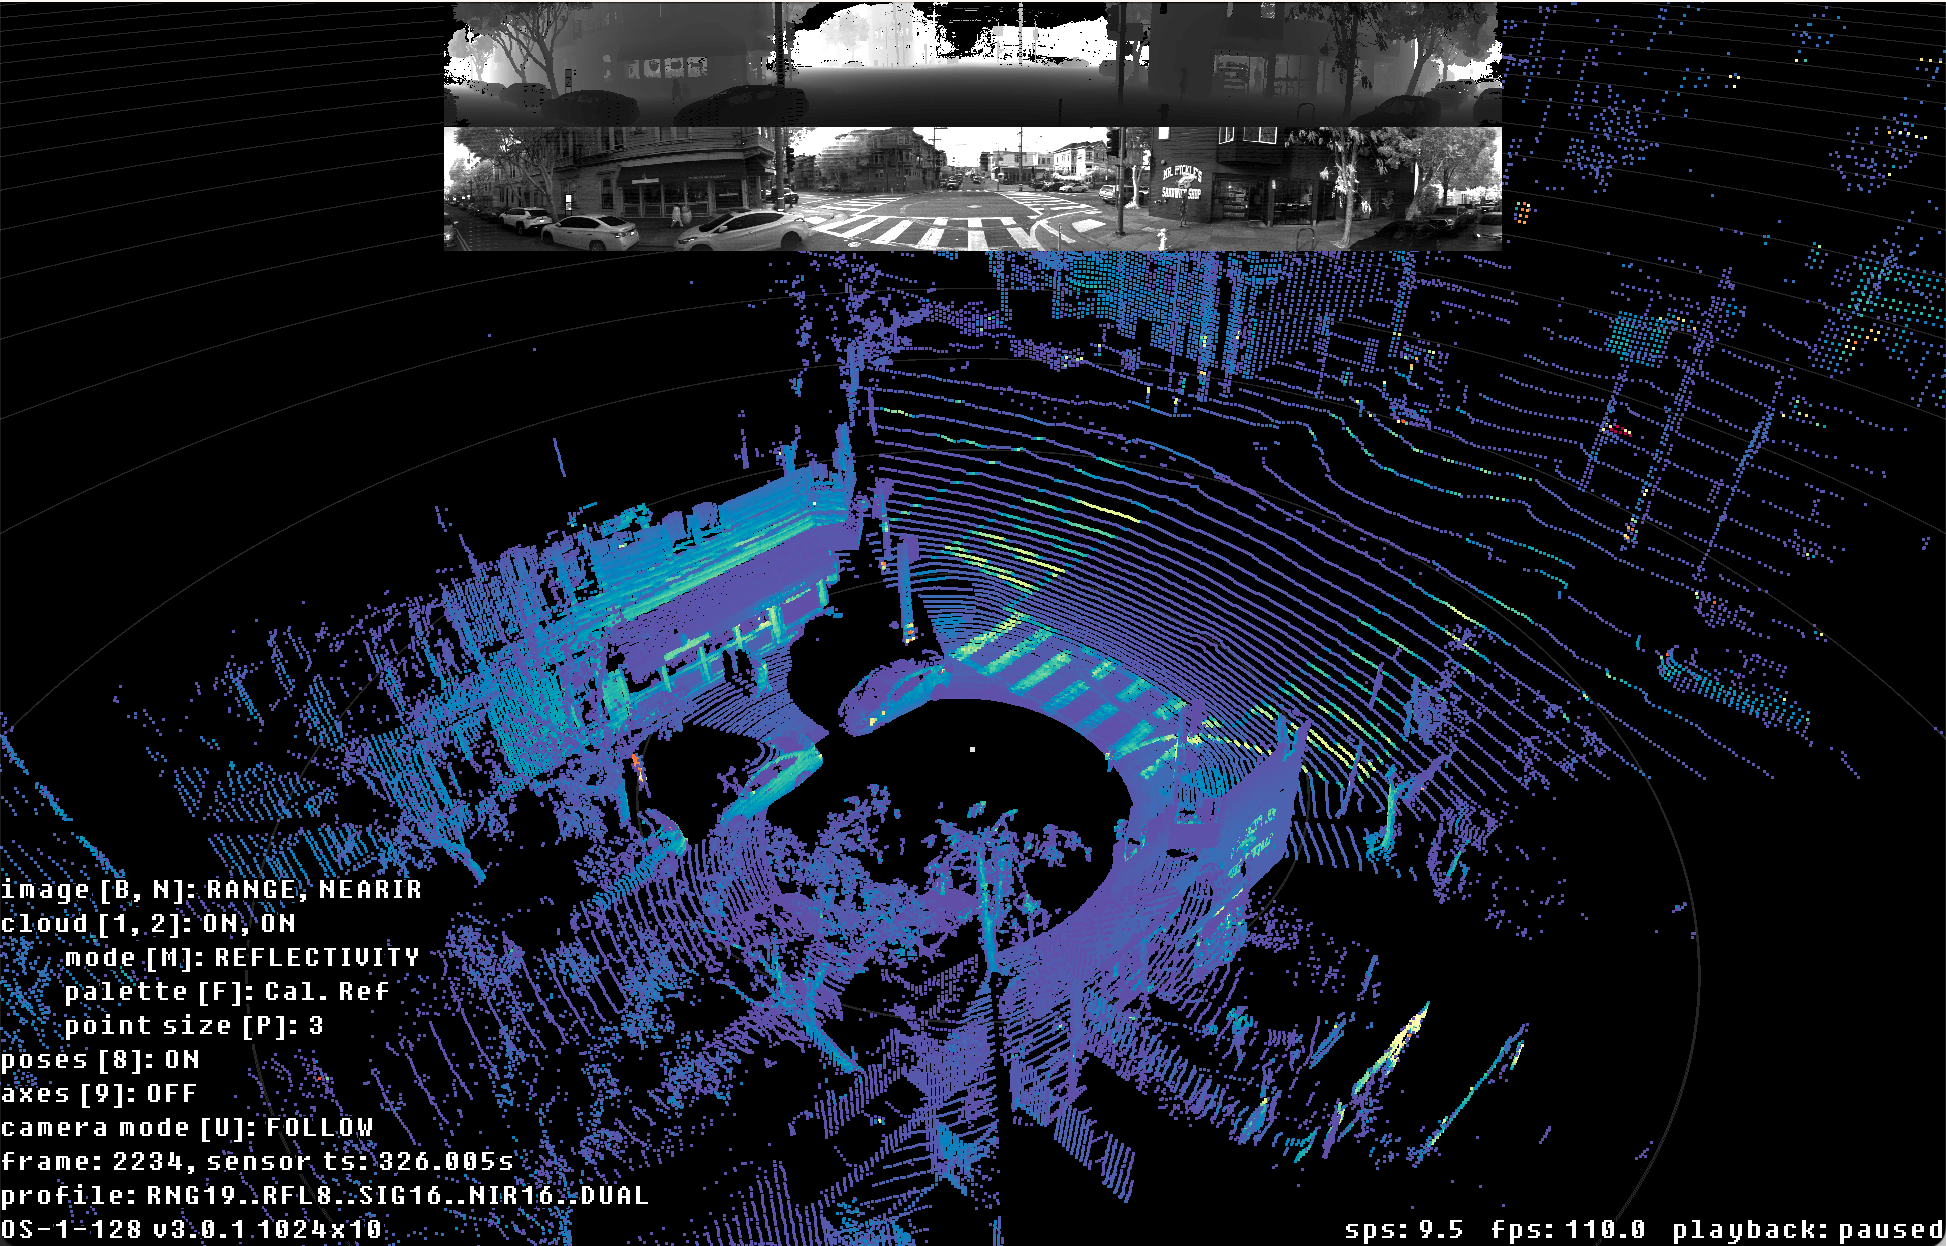
Ouster SDK CLI ouster-cli source OS-1-128.pcap viz visualization of OS1 128 sample data
How to use ouster-cli for visualizations you can learn in Running the Ouster visualizer
To learn how to use slam with ouster-cli and programmatically for visualizations, refer to Visualize SLAM Poses using SimpleViz - accumulates track, point clouds and map views
Visualizing LidarScan(s) using Python API
If you want to visualize a LidarScan or a list of LidarScans using the python API, you can use
ouster.sdk.viz.ls_show() method. Here is a code snippet that shows how it can be used to
visualize a list of LidarScan:
from ouster.sdk import open_source
from ouster.sdk import viz

# Load a LidarScan from a given source (could be a pcap file, OSF file, or a live sensor)
scan_source = open_source(source_url)
# Visualize the LidarScan
scans = next(scan_source)
viz.ls_show(scans)

# When using an indexed source you can do this instead
idx = 0  # example index
viz.ls_show(scan_source[idx]) # where idx is a valid index value into the source
This will open an interactive window displaying the LidarScan as PointCloud.
Additionally, ls_show accepts a list or slice of LidarScan(s), the following snippet shows this use:
# the following will visualize the first 3 scans simultaneously
viz.ls_show([scan_source[0][0], scan_source[1][0], scan_source[2][0]])

# the following will visualize a range of scans from the scan_source
viz.ls_show(scan_source[0:10])
In the first example will pass a list of scans to ls_show, these scans will appear in SimpleViz window
at the same time, you can toggle each scan on/off within SimpleViz using CTRL+num which is very helpful
to compare scans side by side. It is worth noting that the scans doesn’t need to be from the same source.
In the second example, we are passing a slice of scans to ls_show, this will visualize the scans
within the slice sequentially. You can press the spacebar to unpause the playback or use the
<, > keys to step back and forth between scans.
For more advanced visualization you can explore a programmatically accessible viz.PointViz
API below:
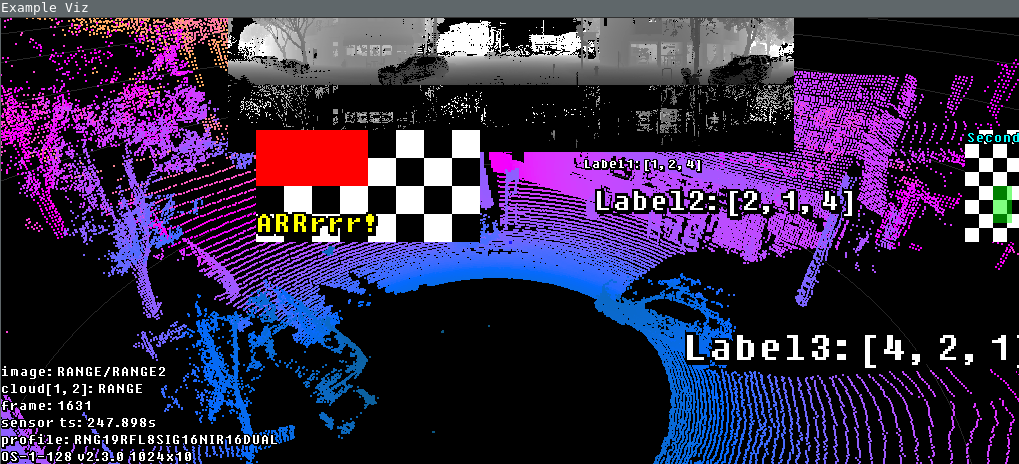
PointViz with Image, Label and masks applied