Visualize SLAM Poses using SimpleViz - accumulates track, point clouds and map views
Overview
Beginning in ouster-sdk 0.13.0, it’s easier than ever to use “map” or “scan”
accumulation to visualize lidar scans that contain pose information. The
default visualizer, SimpleViz, present in both ouster-cli and Ouster
SDK’s Python API support these accumulation modes out of the box.
Furthermore, when poses are not present in the LidarScan accumulation may
still be useful to view the accumulated N scans from the live
sensor/recording and reveal the accuracy/repeatability of the data.
Slam Viz command
The viz command enables visualizing the accumulated point cloud generation during the
SLAM process. By default, the viz operates in looping mode, meaning the visualization will
continuously replay the source file.
ouster-cli source <SENSOR_HOSTNAME> / <FILENAME> slam viz
When combining the viz and save commands, the saving process will automatically terminate
after the first iteration, and then the SLAM process restarts for each subsequent lidar scan iteration.
To end the SLAM and visualization processes after the save operation completes, you can use ctrl + c.
Alternatively, you can add -e exit to the viz command to terminate the process after a
complete iteration.
ouster-cli source <SENSOR_HOSTNAME> / <FILENAME> slam viz -e exit save sample.osf
Accumulation: The viz command supports several options for creating visually-pleasing maps by accumulating data from lidar scans that contain pose information. The following sections describe the options and provide usage examples.
Available view modes
There are three view modes of accumulation implemented in the default visualizer that may be enabled/disabled depending on its parameters and the data that is passed through it:
poses mode - all scan poses in a trajectory/path view (if poses data is present in scans). key
8can be used to toggle the path in viz.map accumulation mode - overall map view with select ratio of random points from every scan (available for scans with or without pose). key
7can be used to toggle the map view.scan accumulation mode - accumulated N scans (key frames) that is picked according to parameters (available for scans with or without poses). key
6can be used to toggle the scan accumulation view.
Ouster CLI viz accumulation options
- scan accumulation options
--accum-num INTEGERAccumulate up to this number of past scans for visualization. Use <= 0 for unlimited. Defaults to 100 if--accum-everyor--accum-every-mis set.
--accum-every INTEGERAdd a new scan to the accumulator for every specified number of scans as an argument in this option.
--accum-every-m FLOATAdd a new scan to the accumulator after specified number of meters of travel.
- map accumulation options
--mapIf set, add random points from every scan into an overall map for visualization. Enabled if either--map-ratioor--map-sizeare set.
--map-ratio FLOATFraction of random points in every scan to add to overall map (0, 1]. [default: 0.01]
--map-size INTEGERMaximum number of points in overall map before discarding. [default: 1500000]
Key bindings
The following key shortcuts apply to accumulation options while running Ouster CLI’s viz command.
Key
Accumulation Mode
What it does
6Scan
Toggle scans accumulation view mode
7Map
Toggle overall map view mode
8Scan & Map
Toggle poses/trajectory view mode
k / KScan & Map
Cycle point cloud coloring mode of accumulated clouds or map
g / GScan & Map
Cycle point cloud color palette of accumulated clouds or map
j / JScan & Map
Increase/decrease point size of accumulated clouds or map
Dense accumulated clouds view (with every point of a scan)
To obtain the densest view use the --accum-num N --accum-every 1 parameters where N is the
number of clouds to accumulate (N up to 100 is generally small enough to avoid slowing down
the viz interface.)
The following example computes poses for each scan using the slam command and creates a dense
map using the viz --accum-num 20 to accumulate the points from 20 scans. Finally, the save command writes the
scans with their computed trajectories to an OSF file. (Note - accumulation is a visualization feature only. The
accumulated data is not saved to the file.):
ouster-cli source <SENSOR_HOSTNAME> / <FILENAME> slam viz --accum-num 20 save sample.osf
and the dense accumulated clouds result:
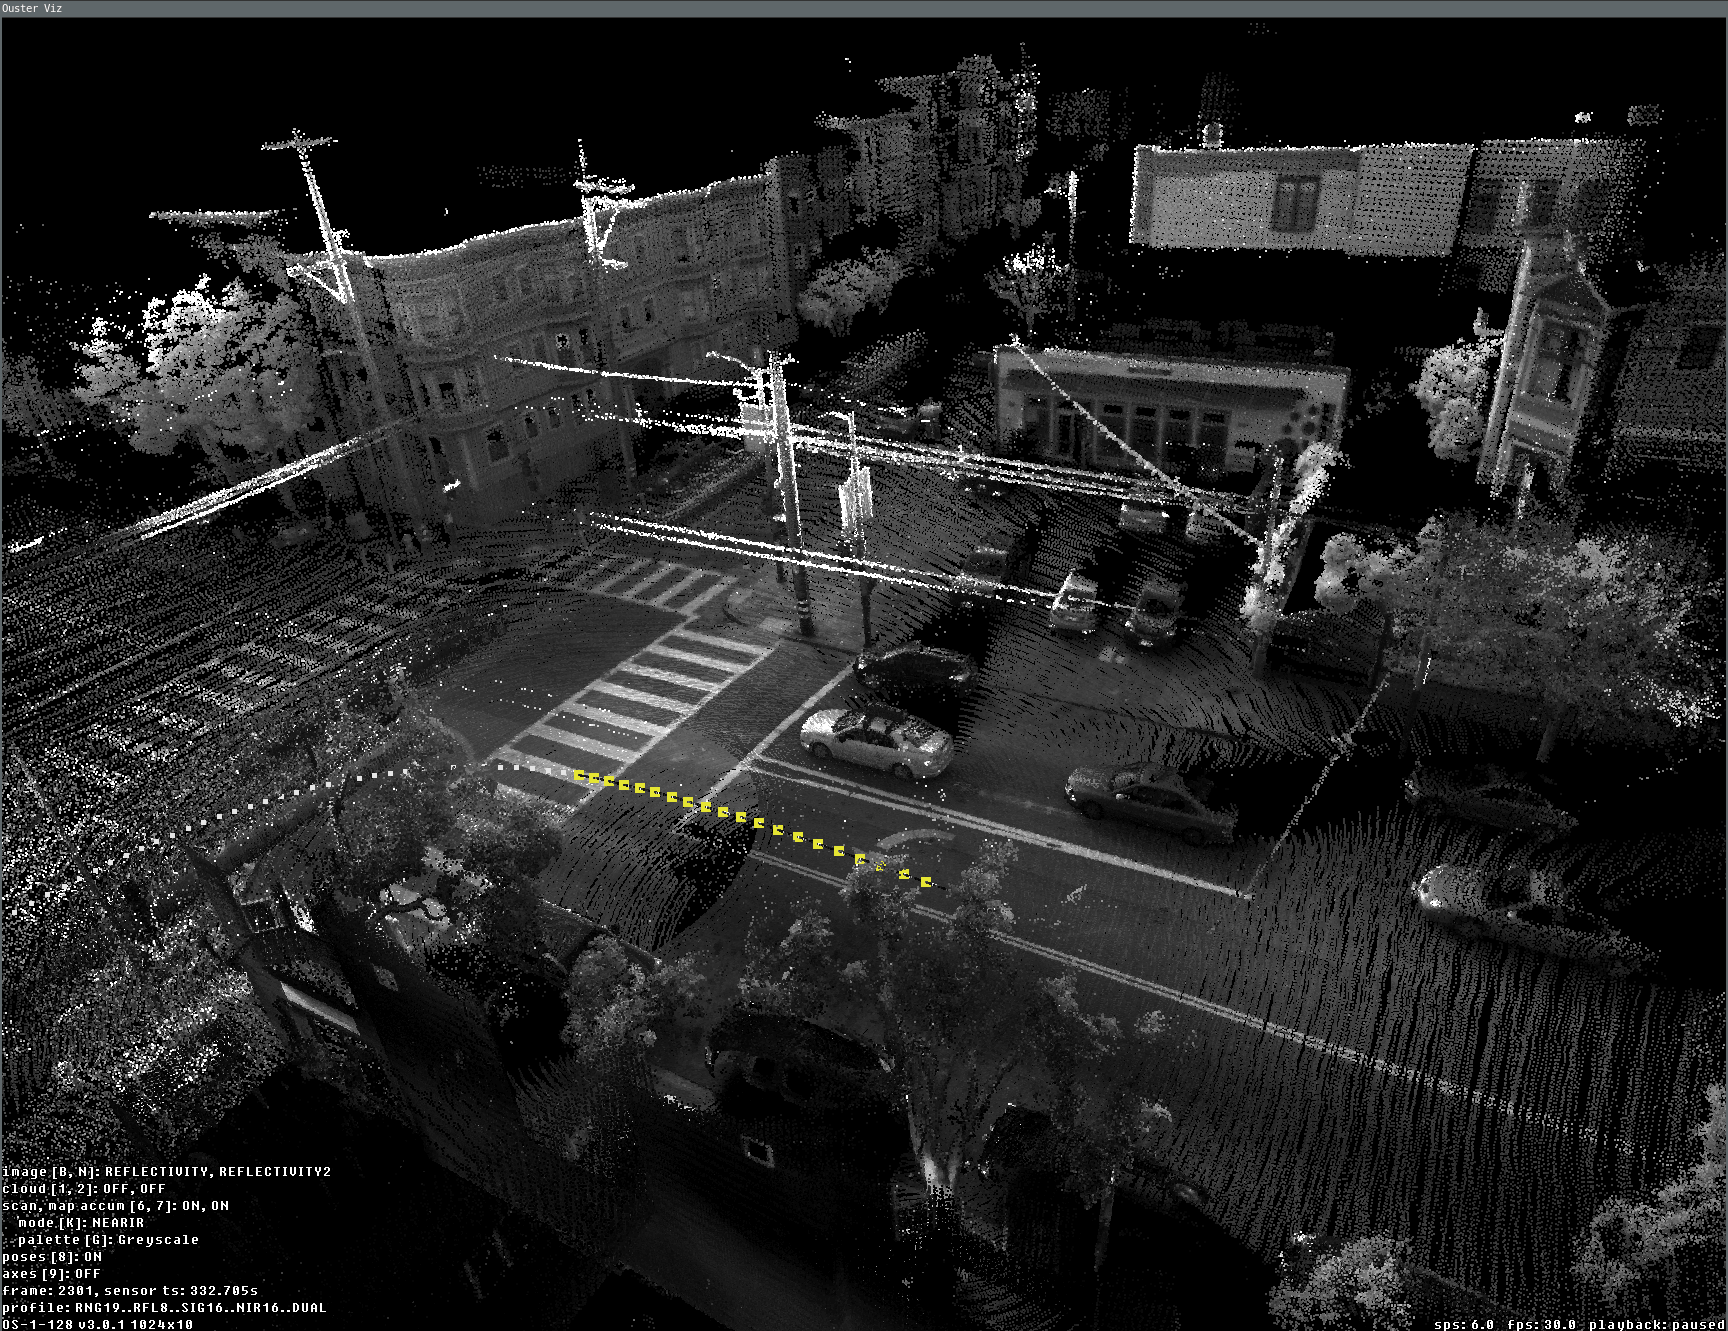
Dense view of 20 accumulated scans during the slam viz run
Overall map view (with poses)
One of the main tasks we frequently need is a preview of the overall map. We can test this by using
the SLAM-generated OSF file, which was created with the above command and contains the
SLAM trajectory in LidarScan.pose. If you are using a SLAM-generated OSF, you can directly use
viz with scan accumulator feature without appending the slam option.
ouster-cli source ouster_sensor_recording.osf viz --accum-num 20 \
--accum-every 0 --accum-every-m 10.5 --map -r 3 -e stop
Here is a preview example of the overall map generated from the accumulated scan results. By utilizing the ‘-e stop’ option, the visualizer stops once the replay process finishes, displaying the preview of the lidar trajectory:
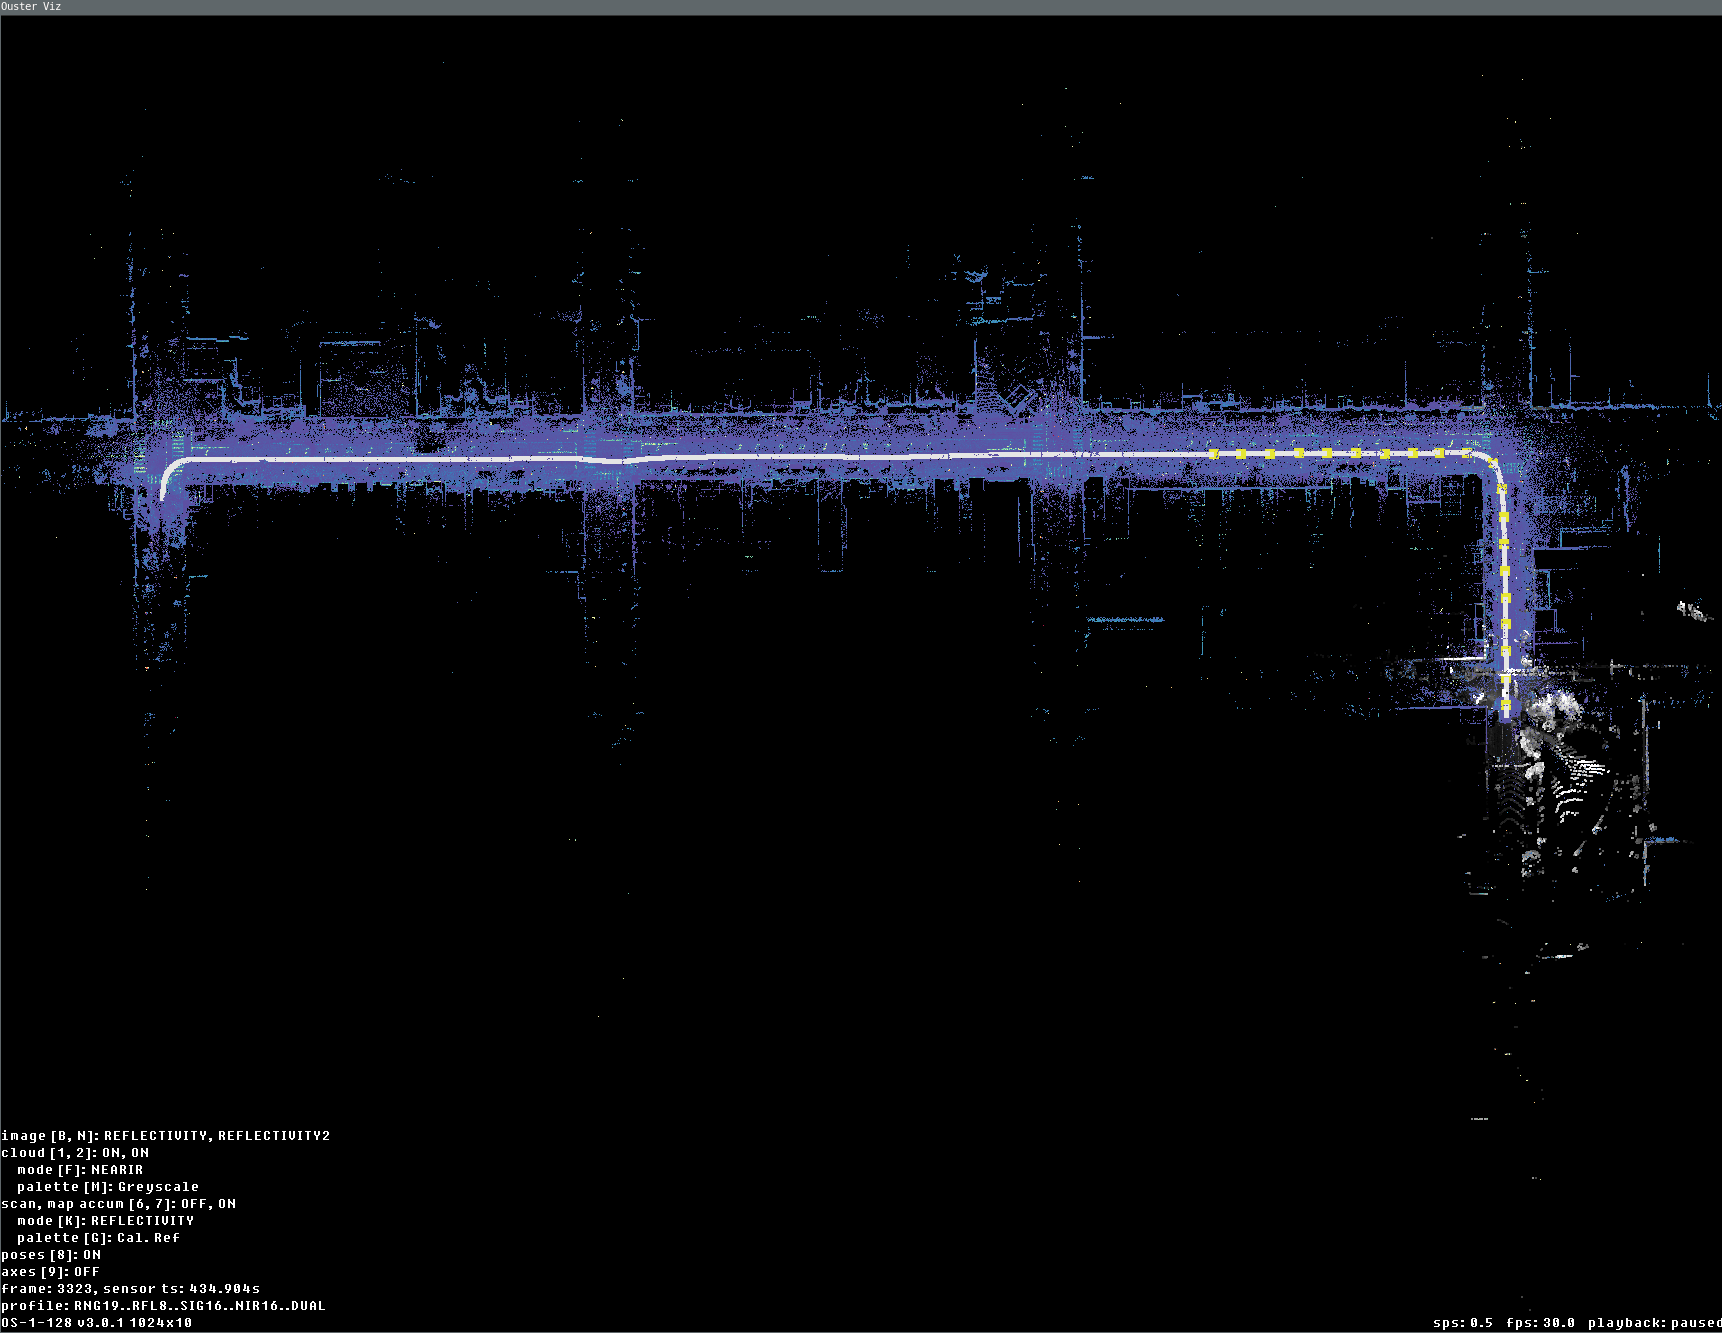
Data fully replayed with map and accum enabled (last current scan is displayed here in gray palette)
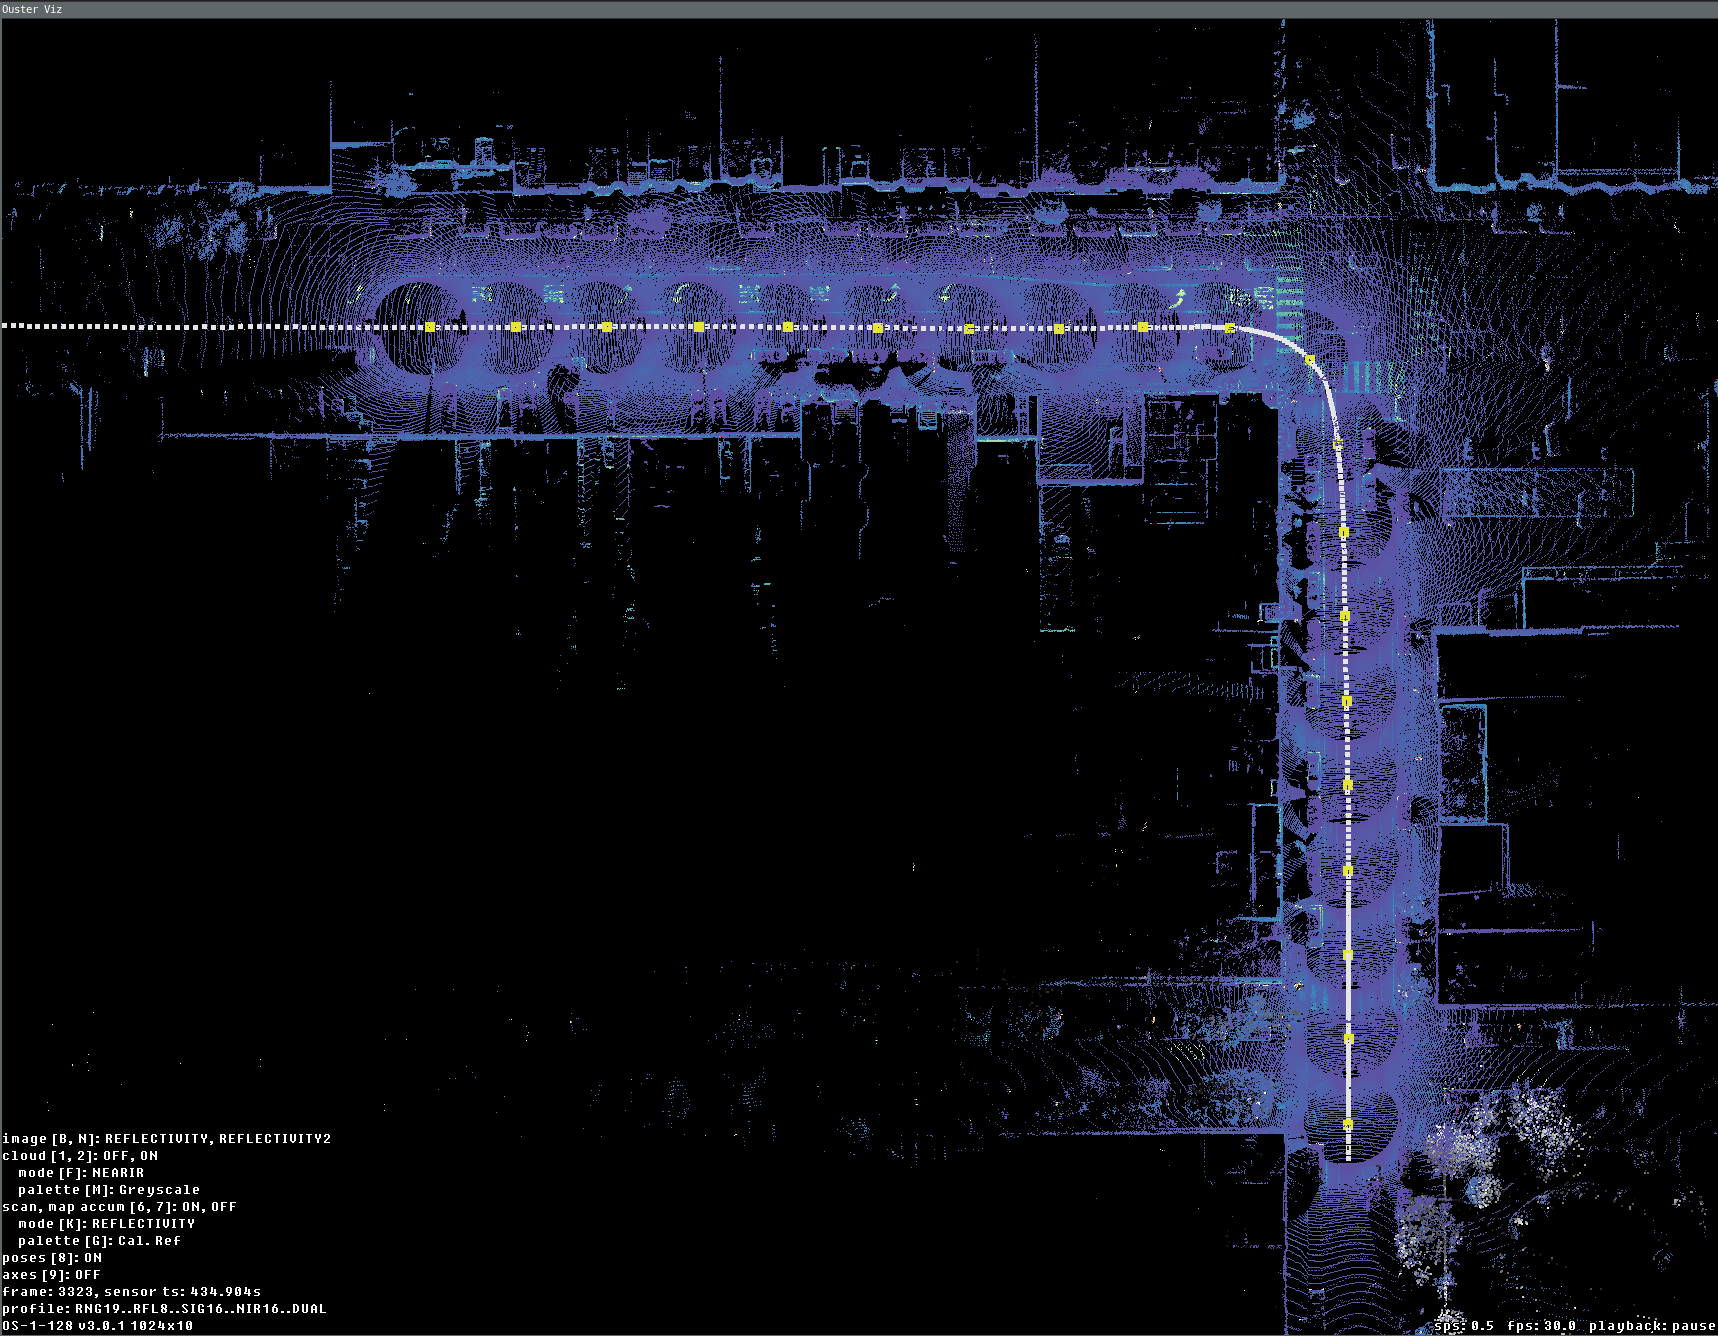
Data fully replayed with view only last 20 scans accumulated every 10.5 meters
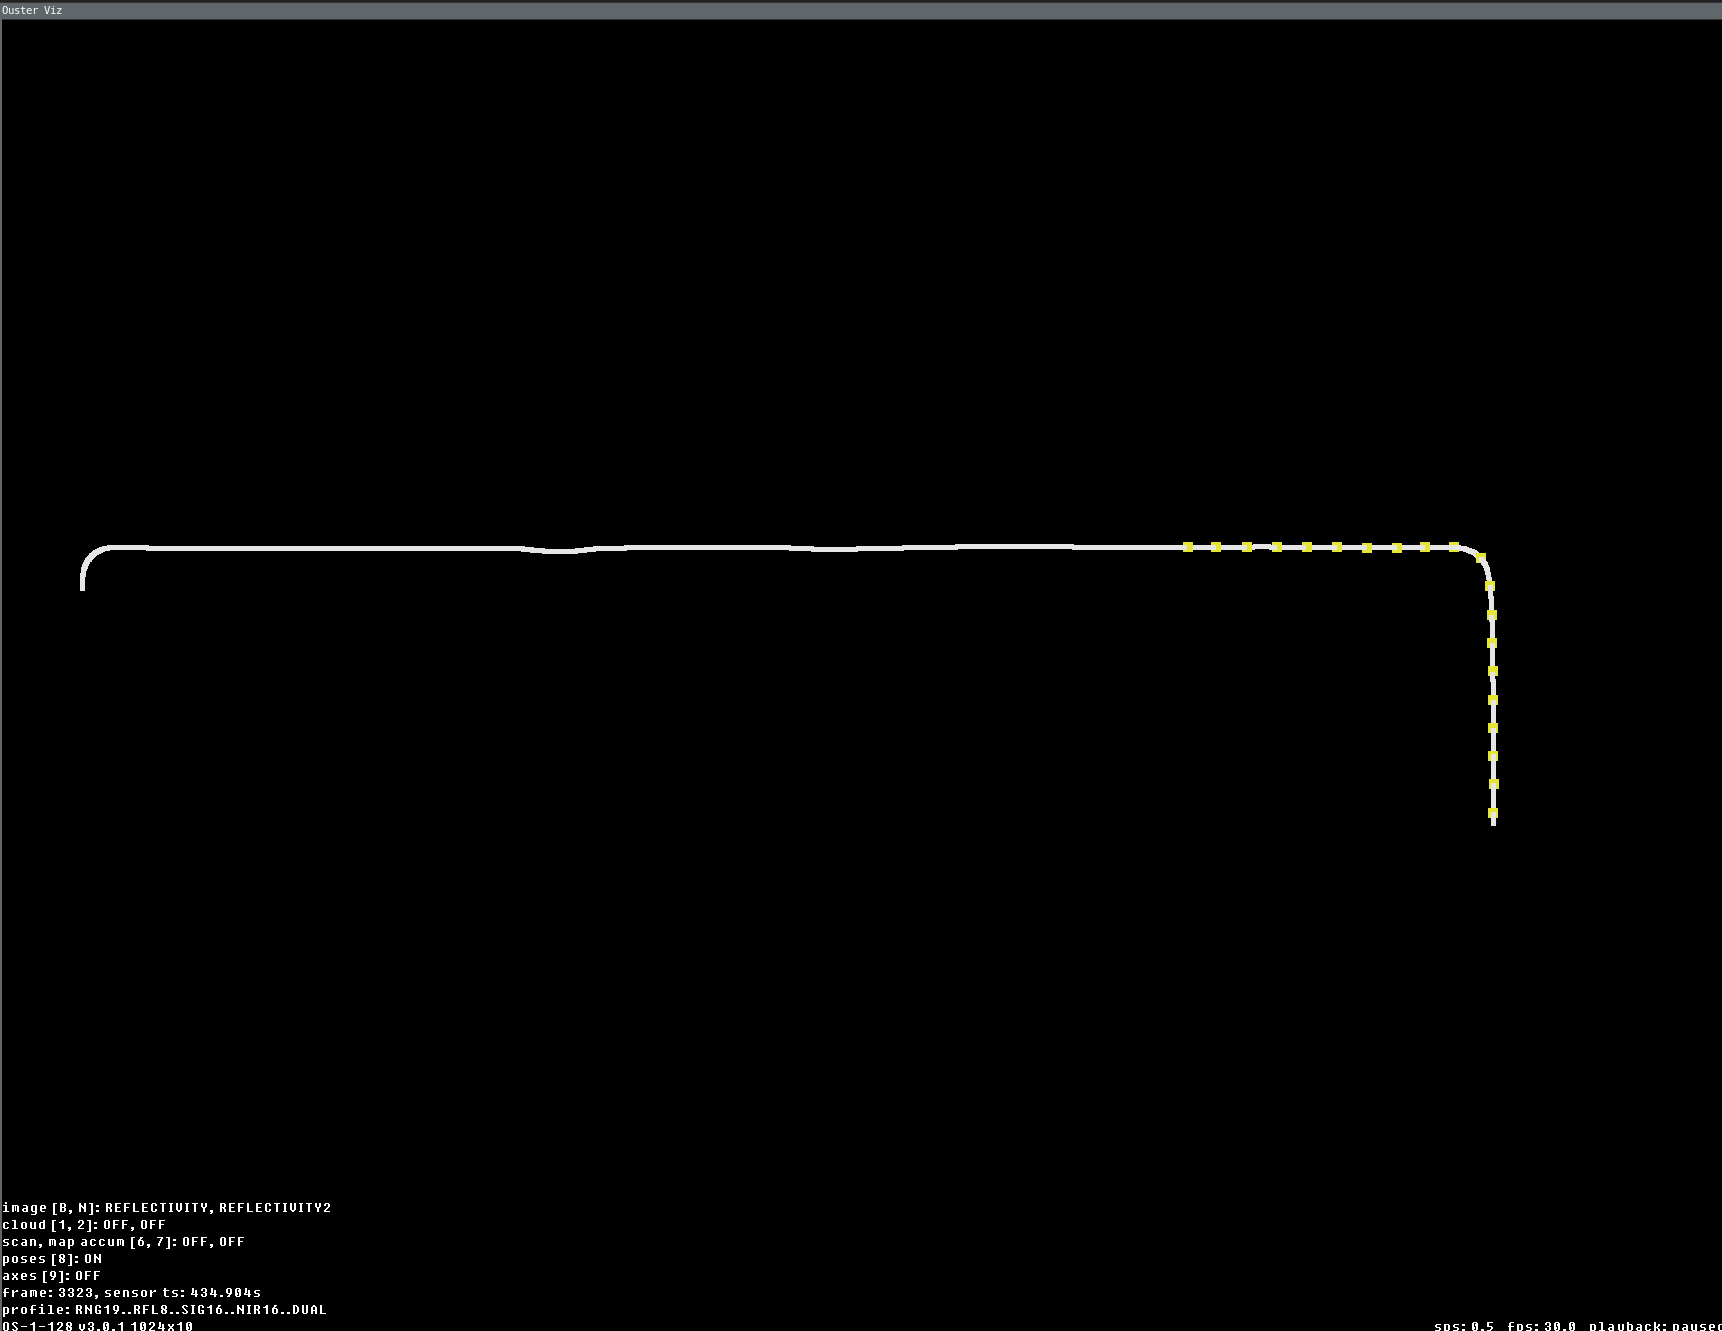
Data fully replayed with view of only trajectory (yellow knobs is 20 accumulated key frames positions)
Programmatic use
To use any of these accumulation modes, provide their configuration directly to SimpleViz via keyword arguments. The following snippet will play back scans from the source scans_w_poses and the sensor configuration provided by meta:
import sys
from ouster.sdk import open_source
from ouster.sdk.viz import SimpleViz
from ouster.sdk.mapping import SlamConfig, SlamEngine

source_uri = sys.argv[1]
source = open_source(source_uri)
config = SlamConfig()
slam = SlamEngine(source.sensor_info, config)

def scans_w_poses():
    for scan in source:
        yield slam.update(scan)


viz = SimpleViz(
    source.sensor_info,
    accum_max_num=100,
    accum_min_dist_num=0,
    accum_min_dist_meters=4,
    rate=1,
    on_eof='stop'
)

viz.run(scans_w_poses())
Alternatively, LidarScanViz (which is a lower-level visualizer that implements SimpleViz) can display a static map
from scans that have poses computed in a preprocessing step:
import sys
from tqdm import tqdm  # for progress bar
from ouster.sdk import open_source
from ouster.sdk.viz import LidarScanViz
from ouster.sdk.viz.accumulators_config import LidarScanVizAccumulatorsConfig
from ouster.sdk.mapping import SlamConfig, SlamEngine

source_uri = sys.argv[1]
source = open_source(source_uri)
config = SlamConfig()
slam = SlamEngine(source.sensor_info, config)

num_scans_to_map = 200
scans_w_poses = [
    slam.update(scan) for _, scan in
    zip(tqdm(range(num_scans_to_map), desc="Computing map"), source)
]

viz = LidarScanViz(
    source.sensor_info,
    accumulators_config = LidarScanVizAccumulatorsConfig(
        accum_max_num=100,
        accum_min_dist_num=0,
        accum_min_dist_meters=4
    )
)

for scan in scans_w_poses:
    viz.update(scan)

viz.draw(update=True)
viz.run()